


FXOpen

BTC/USD
The price of Bitcoin has been moving sideways since last Friday when it came up to $15,977 at its highest point and from there fell to around $14,412 on Saturday. Since Saturday’s low, recovery has been made with the price reaching $15,860 on Monday but from there fell again to $14,850 area. Currently, it is being traded at $15,276 and is showing signs of weakness as it made an interaction with the descending trendline and found resistance there.
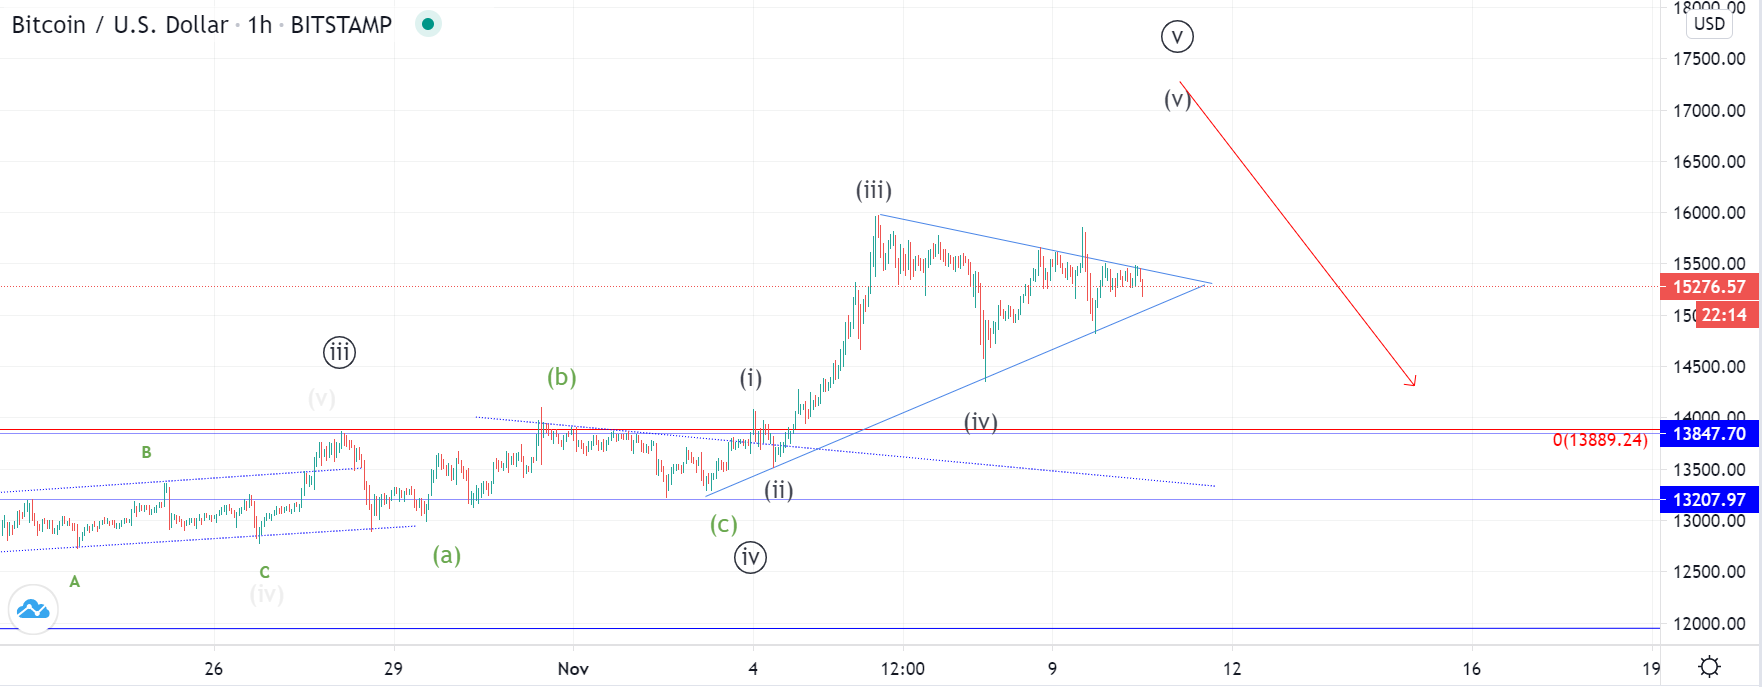
On the hourly chart, you can see that this descending trendline is the resistance level from the triangle which has been forming since last Friday’s high with its support level being the uptrend line from the 4th of November.
This is most likely the 4th wave correction out of the next impulse wave to the upside which is why we are seeing this triangle forming as a consolidation range. Considering that the support level dates a bit earlier and is a bit steeper we could expect to see a breakout to the upside, especially considering that the price is getting close to its apex.
If a breakout occurred to the upside like expected, that would be the 5th wave out of the higher degree count which would develop and would then mean that a more significant correction is coming. The price target for the expected increase would be somewhere between $16,820 to $17,200 level.
XRP/USD
The price of Ripple has been increasing from yesterday and came up by around 7% from its lowest at $0.2464 to $0.264 at its highest spike. Since then it has made a minor retracement and is now being traded at around $0.2565 where the prior local horizontal support level is.
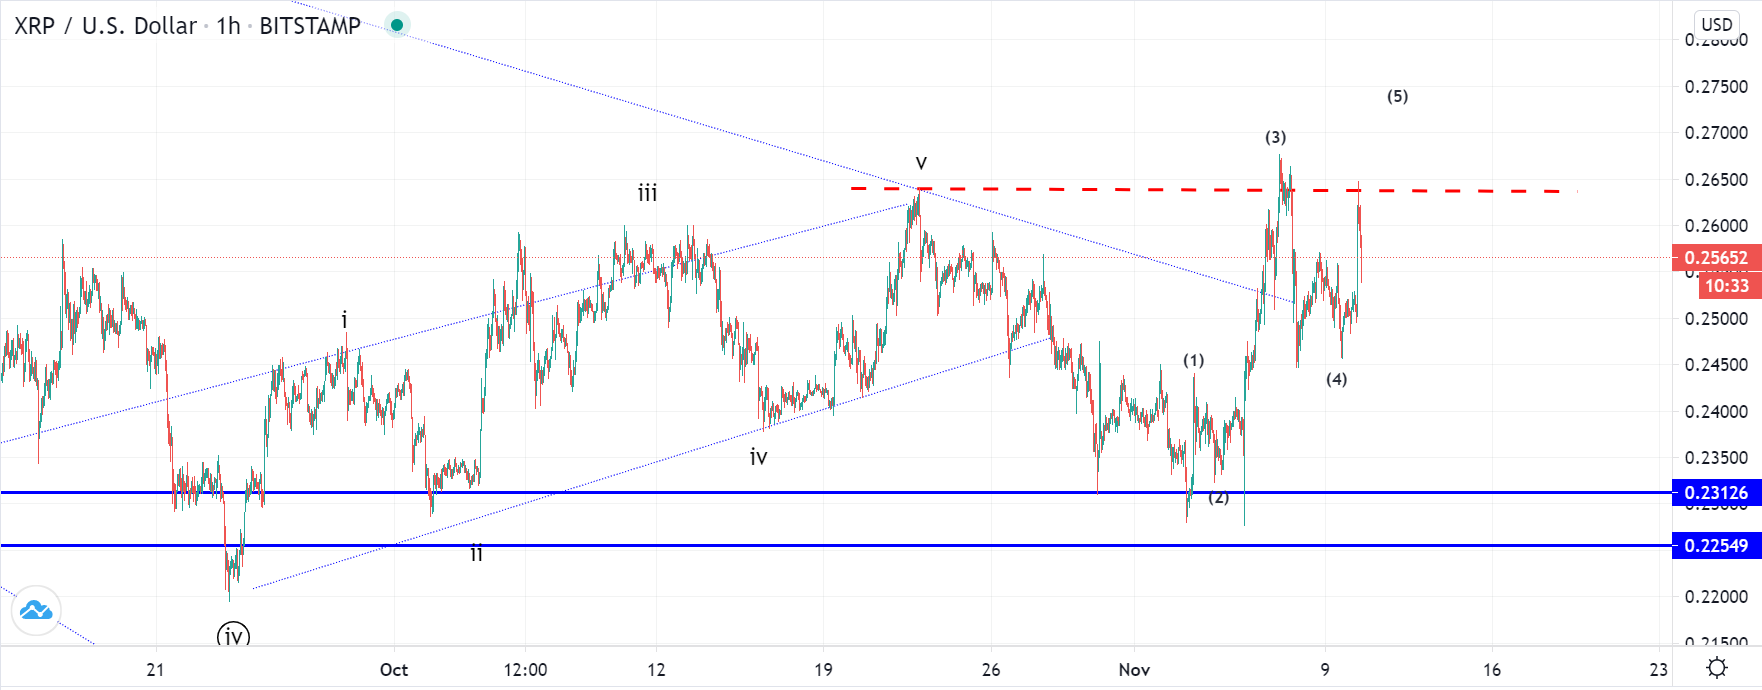
On the hourly chart, we can see that this is the continuation of the increase from the interaction with the $0.23126 level where the price fell down after breaking out from the ascending channel. We have seen an impulsive rise with the price finding resistance again on the same level as in the case of the prior increase which was labeled as the 5th wave.
This is why we have seen a minor pullback which is the 4th wave if the rise is to develop in a five-wave manner. Another wave to the upside would be expected next above the $0.265 resistance zone, but not by a significant amount as the 3rd wave got extended.
Another possibility could be that we are going to see a truncation with the 5th wave finding resistance again on the same level as the 3rd.
FXOpen offers the world's most popular cryptocurrency CFDs*, including Bitcoin and Ethereum. Floating spreads, 1:2 leverage — at your service. Open your trading account now or learn more about crypto CFD trading with FXOpen.
*At FXOpen UK and FXOpen AU, Cryptocurrency CFDs are only available for trading by those clients categorised as Professional clients under FCA Rules and Professional clients under ASIC Rules respectively. They are not available for trading by Retail clients.
This article represents the opinion of the Companies operating under the FXOpen brand only. It is not to be construed as an offer, solicitation, or recommendation with respect to products and services provided by the Companies operating under the FXOpen brand, nor is it to be considered financial advice.
Latest articles

Google Share Price Rose Post-market to a New All-time Record
Yesterday, after the close of the main trading session, a report on activities for the 1st quarter of Alphabet Inc. (Google's parent company) was published. The report was strong, exceeding investors' expectations.
→ Quarterly EPS = USD 1.89 (expected = USD 1.

S&P 500 Rebounds after Negative GDP News
Data released yesterday showed US GDP growth slowed to 1.6% in the first quarter of the year. According to ForexFactory: forecast = 2.2%, past value = 2.4%.
Reaction to the news sent the S&P 500 mini stock

GBP/USD And USD/CAD Daily Chart Outlook
GBP/USD is attempting a recovery wave from 1.2300. USD/CAD is consolidating and might aim for a move above the 1.3760 resistance zone.
Important Takeaways for GBP/USD and USD/CAD Analysis Today
· The British Pound started