


FXOpen

BTC/USD
From last Wednesday when the price of Bitcoin was $6484 at its lowest point we have seen an increase of 18.67% as the price came up to $7694 at its highest point yesterday. Since yesterday’s high the price started pulling back and is currently sitting at around $7360 level.
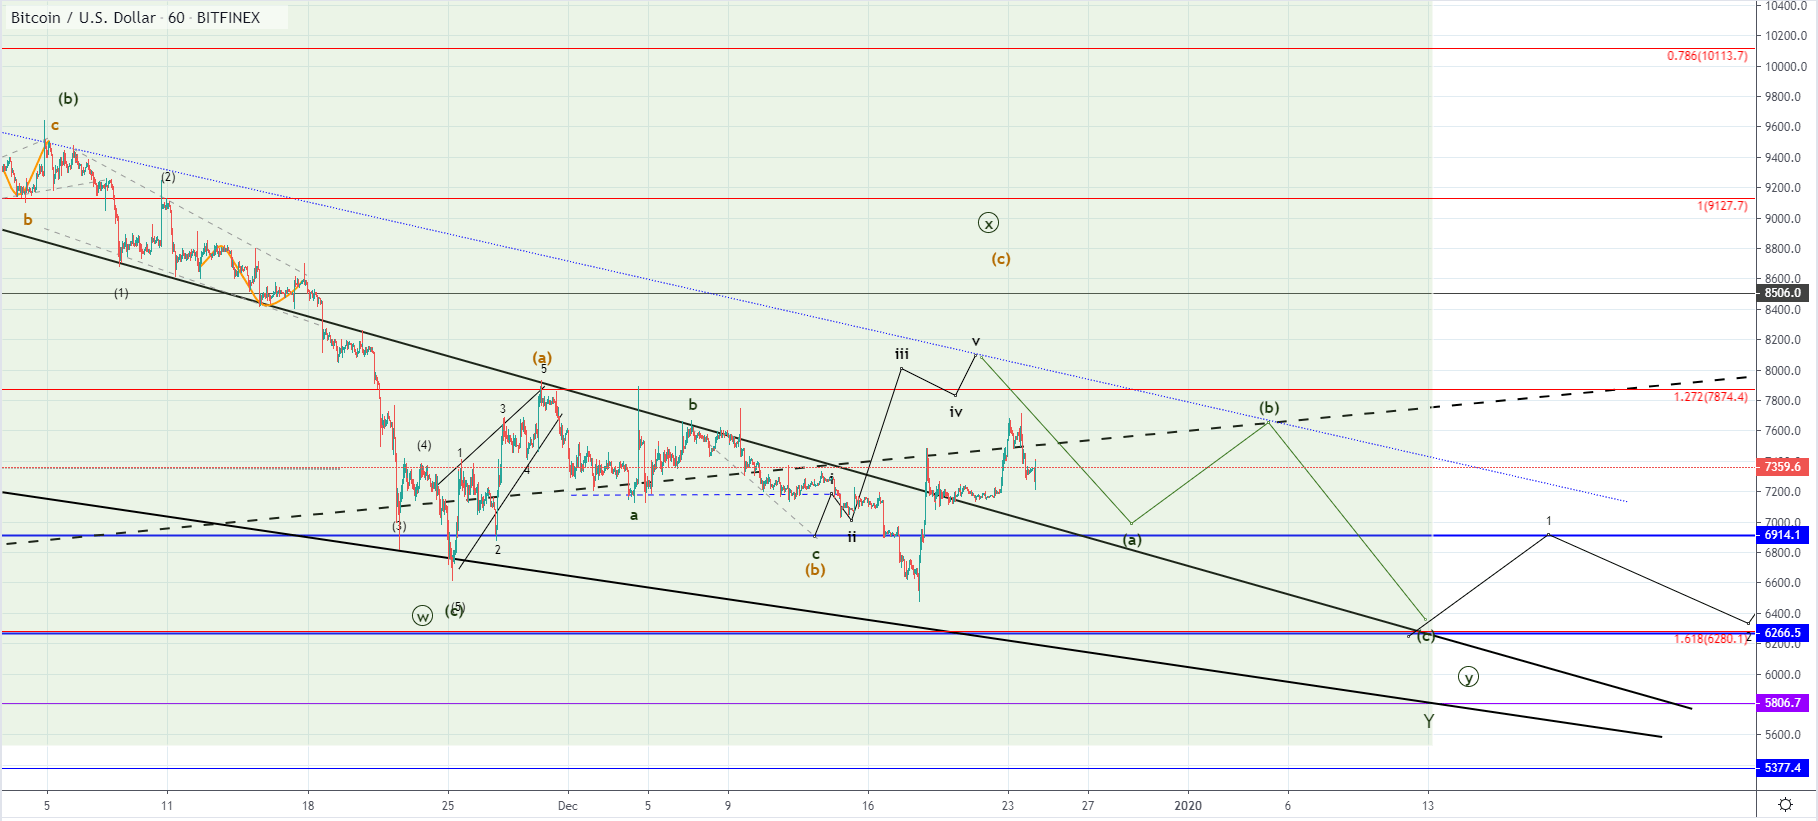 On the hourly chart, you can see that the price of Bitcoin fell below the significant horizontal level at $6914 on the way down and continued moving to the prior low vicinity around $6600. This is considered as a B wave from the ABC correction to the upside after which an impulsive C wave was expected. Indeed we have seen an impulsive move to the upside developing after a retest of the prior low but the price hasn’t come up to retest the descending channels resistance level as expected before starting another downturn.
This could have been the completion of the C wave the upside wave structure could be interpreted as a five-wave move, and especially considering that the B wave ended lower than expected so could have the C wave. As you can see the projection made has slightly higher targets with the C wave presumed to go above the ending point of the A wave. But as the B wave went below the starting point of the A wave this could have been the completion of the ABC to the upside.
We could see potentially another push to the upside but not far further as there are numerous resitance points above the current price levels. Some of them might get retested before another ABC to the upside starts but in either way, I would be expecting further sideways movement before another impulsive downfall from here.
XRP/USD
The price of Ripple has been struggling to get above the $0.2 mark ever since it fell below it last week. It is currently being traded at around $0.19130 and is in a downward trajectory.
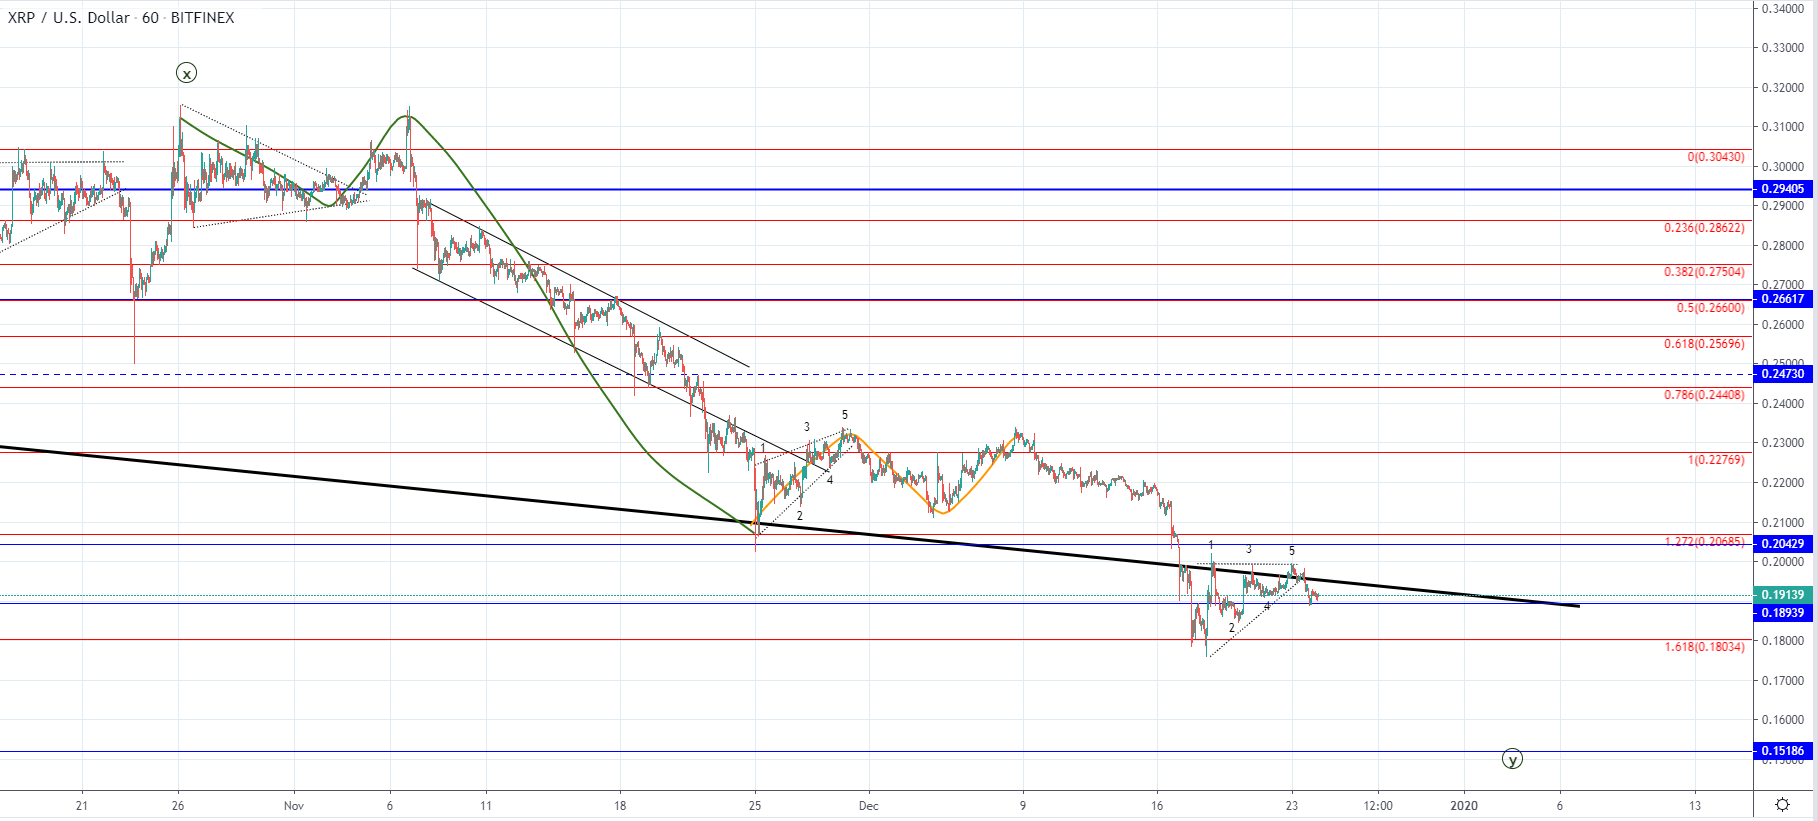 Looking at the hourly chart, you can see that the price retested the descending support level for resistance as it fell below it last week and has finally found resistance there which is starting to cause another downturn. From last week’s low, we have seen the formation of the ascending triangle in which a five-wave move was made and can be interpreted as a leading diagonal from the starting uptrend. In that case, the currently seen depreciation is only a minor retracement before the next impulsive move to the upside starts.
But this could also be another corrective ABCDE before further depreciation for the price of Ripple. If the price stops decreasing above the 1.618 Fib level and starts moving to the upside above the descending trendline it could indicate the start of a recovery. But more likely we are going to see the price of Ripple going below 1.618 Fib level in which case further lows could be expected, potentially down to $0.15186 as its the next significant horizontal level in line.
FXOpen offers the world's most popular cryptocurrency CFDs*, including Bitcoin and Ethereum. Floating spreads, 1:2 leverage — at your service. Open your trading account now or learn more about crypto CFD trading with FXOpen.
*At FXOpen UK and FXOpen AU, Cryptocurrency CFDs are only available for trading by those clients categorised as Professional clients under FCA Rules and Professional clients under ASIC Rules respectively. They are not available for trading by Retail clients.
This article represents the opinion of the Companies operating under the FXOpen brand only. It is not to be construed as an offer, solicitation, or recommendation with respect to products and services provided by the Companies operating under the FXOpen brand, nor is it to be considered financial advice.
Latest articles

META Share Price Collapses after Publication of Quarterly Report
Just yesterday, META's stock price closed at USD 493.50, up approximately 40% since the start of 2024 and up nearly 300% since the start of 2023.
However, following the release of Meta's quarterly report, its shares plummeted to USD

USD/JPY Analysis: The Rate Exceeds The Level of 155 Yen Per US Dollar
Today, the price of USD/JPY once again renewed its 34-year high, exceeding the level of 155 yen per dollar, which put pressure on the current authorities.
According to Reuters, officials are trying to maintain calm in the market.
"We

Yen in Search of New Lows, Commodity Currencies at a low Start
In recent trading sessions, the dollar has been trading quite differently to leading currencies. Thus, the yen is reaching historical lows, European currencies have managed to correct, and the Australian and Canadian dollars are testing strategic supports.
USD/JPY
The