


FXOpen
BTC/USD
On Sunday the price of Bitcoin was sitting at $7288 at its highest point from where it started decreasing in a five-wave manner. Yesterday we have seen a slight recovery but after it’s a completion at $7218 the price started impulsively decreasing falling to $6777 at it’s lowest point yesterday. Since then another minor recovery has been seen with the price currently being traded at $6861.
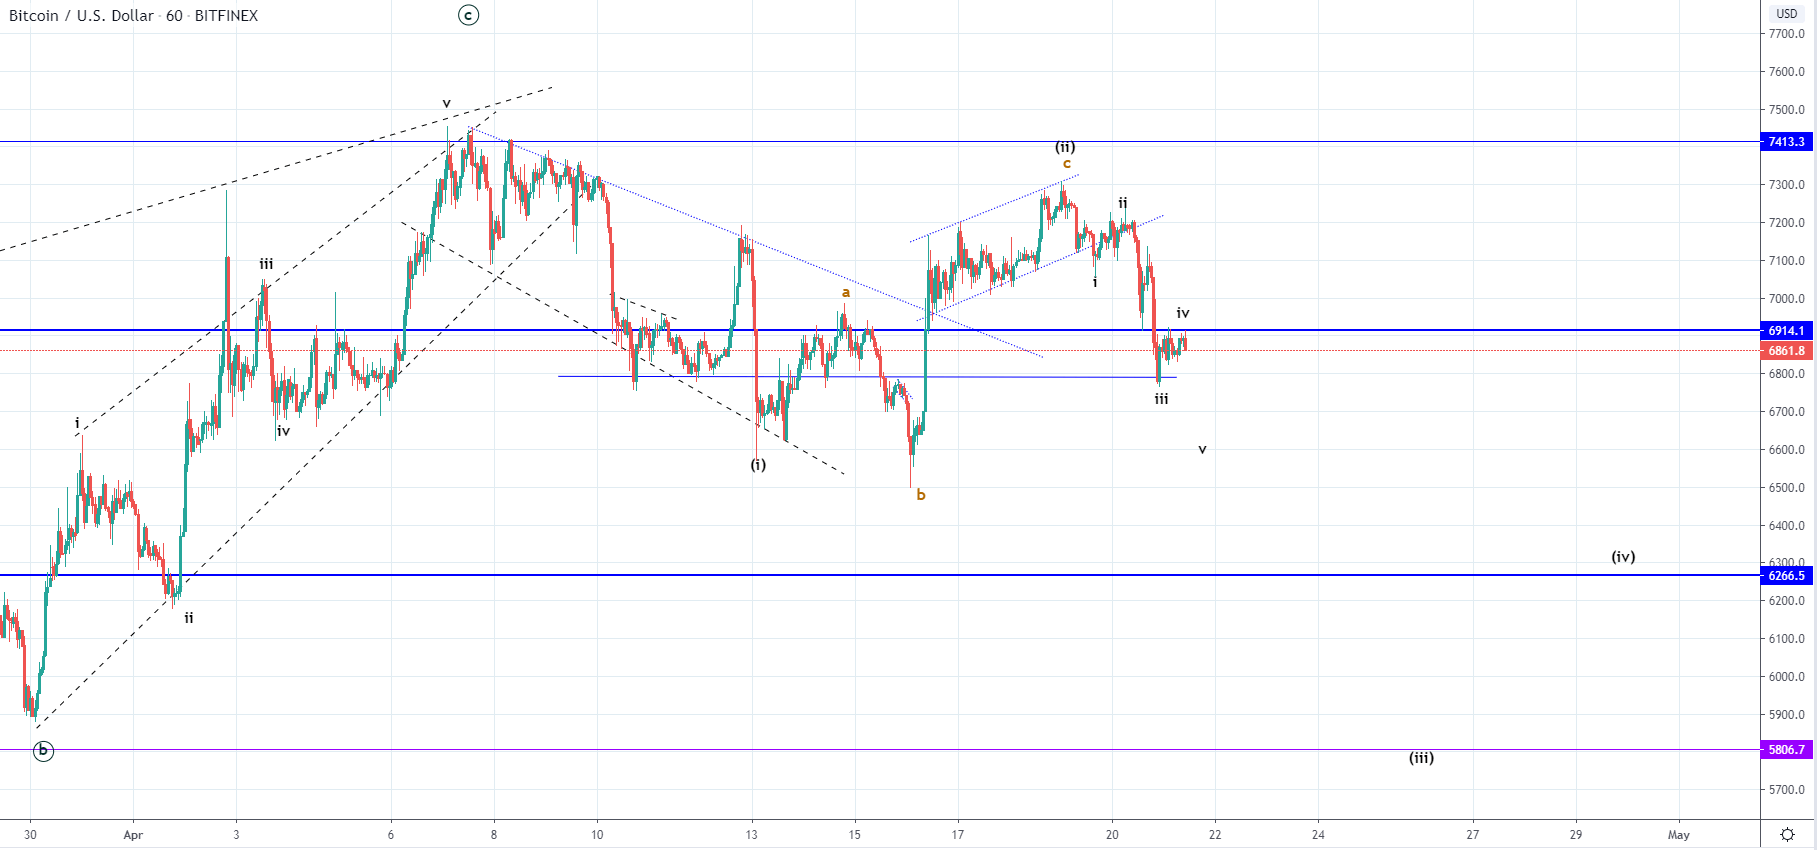 On the hourly chart, you can see that the price fell below the significant horizontal support at $6914 and has retested it today, finding resistance there. This rejection would most likely push the price to continue moving for another lower low, especially considering that from Sunday’s high we have seen a 4 wave’s developing and is likely to ends as a five-wave decrease.
If this occurs the price would form an impulsive move to the downside after a breakout has been made from the ascending channel. In that case, we could be seeing the development of the 3rd wave from the higher degree count as the prior upside move ending with the mentioned ascending channel could have been corrective 2nd wave and the descending channel from the 7th of April it’s 1st.
The price target for the expected lower low would be at around $6680 but could continue below the ending point of the B wave from the 2nd sub-wave in which case $6450 could be seen. But if the price starts impulsively increasing from here the count would be valid until it would reach $7100 where the territory of the 1st wave is.
XRP/USD
The price of Ripple has been following the same pattern as in the case of Bitcoin. From Sunday’s high at $0.197 we have seen a decrease to $0.189 horizontal level, a bounce from it to $0.194 but immediately after fell to $0.1793 which is a decrease of 7.95% from yesterday’s high. Now the price is sitting at around $0.183 and is in a downward trajectory after a minor recovery.
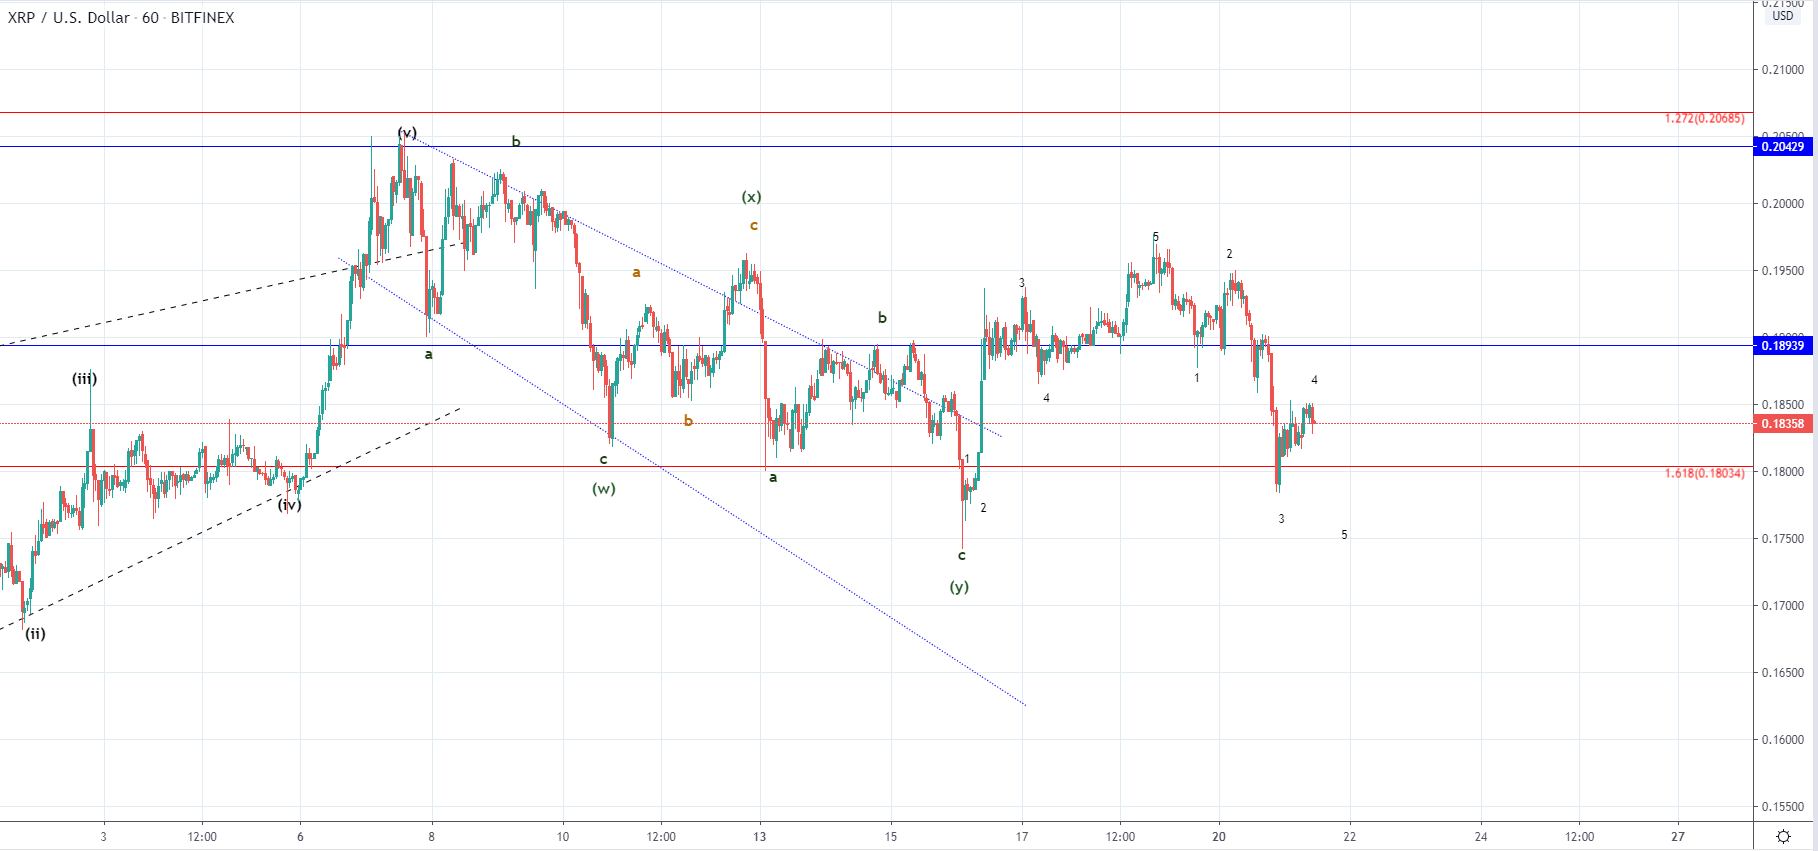 Looking at the hourly chart, you can see that like in the case of Bitcoin we have seen 4 waves developing from Sundays high. This is most likely to end as a five-wave decrease with another local lower low below the 1.618 Fibonacci level. Prior to the impulsive descending move, we have seen the price in an upward trajectory in a five-wave manner. This could have been the C wave out of the corrective move to the upside but it could have been the starting wave out of the next impulsive move.
If the price continues moving below the $0.1776 this possibility would be invalidated as the price can’t go below the starting point of it’s 1st wave on the 2nd.
FXOpen offers the world's most popular cryptocurrency CFDs*, including Bitcoin and Ethereum. Floating spreads, 1:2 leverage — at your service. Open your trading account now or learn more about crypto CFD trading with FXOpen.
*At FXOpen UK and FXOpen AU, Cryptocurrency CFDs are only available for trading by those clients categorised as Professional clients under FCA Rules and Professional clients under ASIC Rules respectively. They are not available for trading by Retail clients.
This article represents the opinion of the Companies operating under the FXOpen brand only. It is not to be construed as an offer, solicitation, or recommendation with respect to products and services provided by the Companies operating under the FXOpen brand, nor is it to be considered financial advice.
Latest from Cryptocurrencies
Latest articles

Weekly Market Wrap With Gary Thomson: UK100, USD, GOLD, OIL
Get the latest scoop on the week's hottest headlines, all in one convenient video. Join Gary Thomson, the COO of FXOpen UK, as he breaks down the most significant news reports and shares his expert insights.
- UK100 Share Index Rises

What Is a Darvas Box Theory and How Does It Work in Trading?
The Darvas Box Theory, pioneered by Nicolas Darvas in the 1950s, has transcended its stock market origins to become a valuable tool for forex traders. This method leverages specific price movements and patterns, known as the Darvas Box, to track

NFLX Stock Price Falls Despite Subscriber Growth
Yesterday, after the close of the main trading session on the stock market, Netflix reported to investors for the 1st quarter of 2024.
The report turned out better than expected:
→ earnings per share: actual = USD 5.28, forecast = USD 4.