


FXOpen

BTC/USD
The price of Bitcoin has continued its upward trajectory from last Monday and came up from $37,691 at its lowest point to $49,808 at its highest point on Sunday which was an increase of 32.15%. From Sunday’s high, we have seen a pullback to the $46,000 zone but the price is now once again in an upward trajectory. Currently, it is sitting just slightly above $49,000 mark and is testing its horizontal resistance.
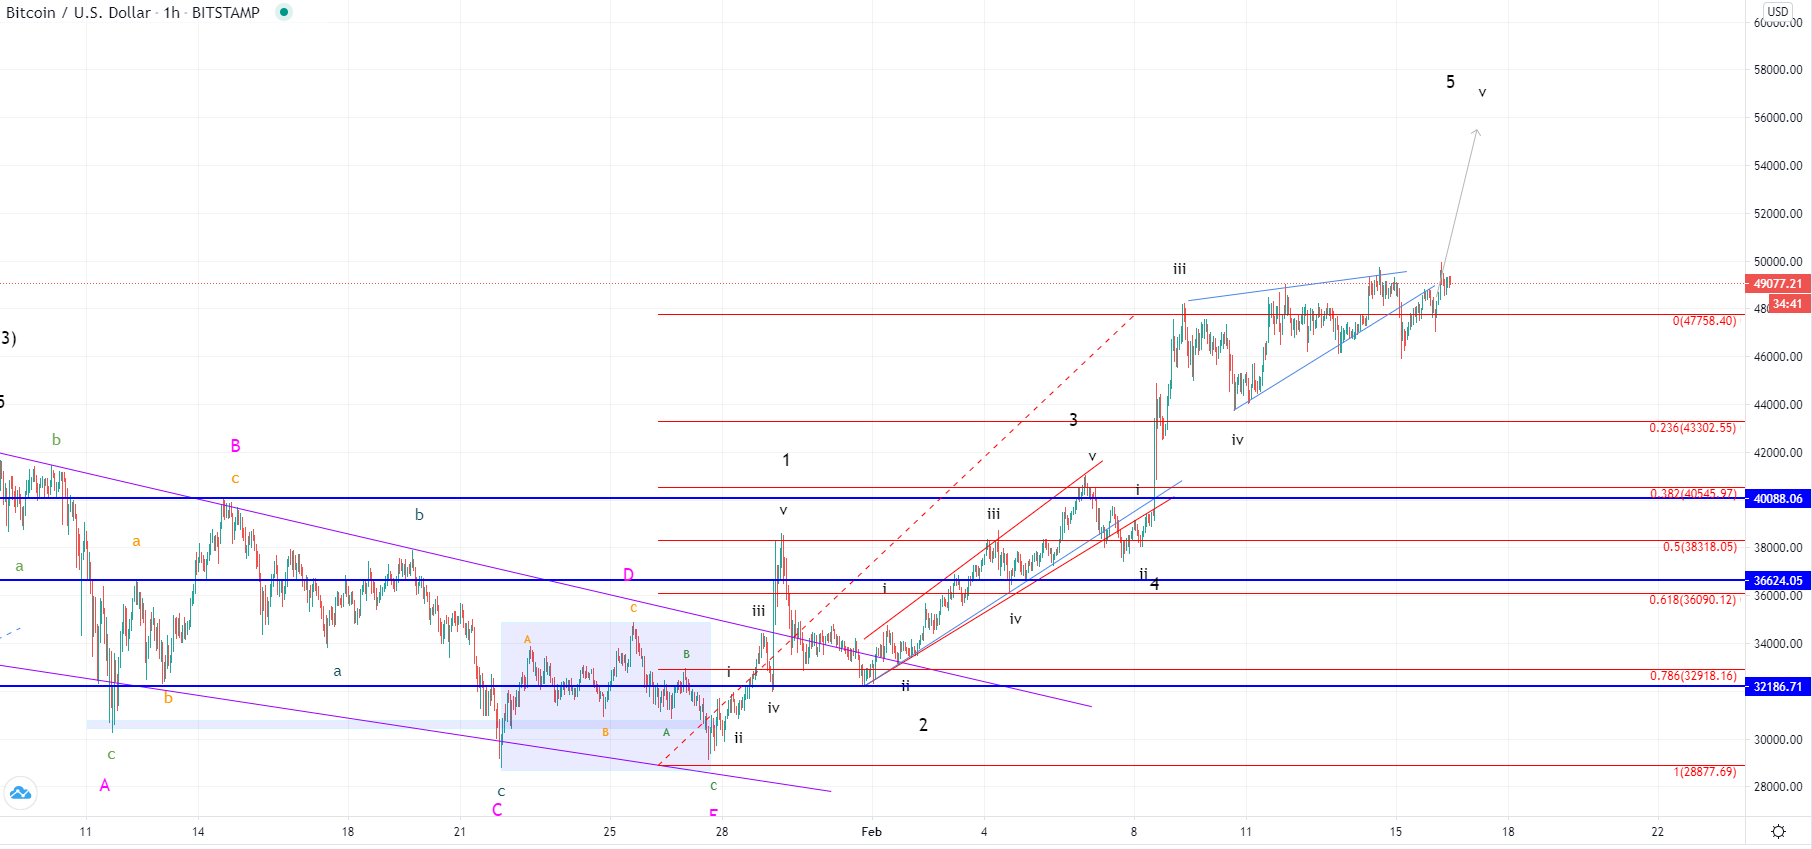
On the hourly chart, you can see that this rise is the next developing 5th wave from the higher degree impulse and from the lower degree one as well. This is why further upside would be expected but is most likely the ending wave from the rise that started on the 27th of January.
The price has been forming an ascending triangle from the 9th of February when the 3rd impulse wave was formed out of the lower degree. Now as the price has reached the apex of the triangle and then retraced back it appears that it made the completion of the 4th wave corrective structure.
If this is true now another impulse to the upside has started with the price leading towards a new all-time high, potentially above $52,000.
XRP/USD
From Saturday’s high at $0.64, the price of Ripple has made a decrease of 20.20% as it fell to $0.51 at its lowest point yesterday. From there we have seen a minor recovery with the price coming to $0.587 but is now again being traded lower, currently sitting at around $0.55628.
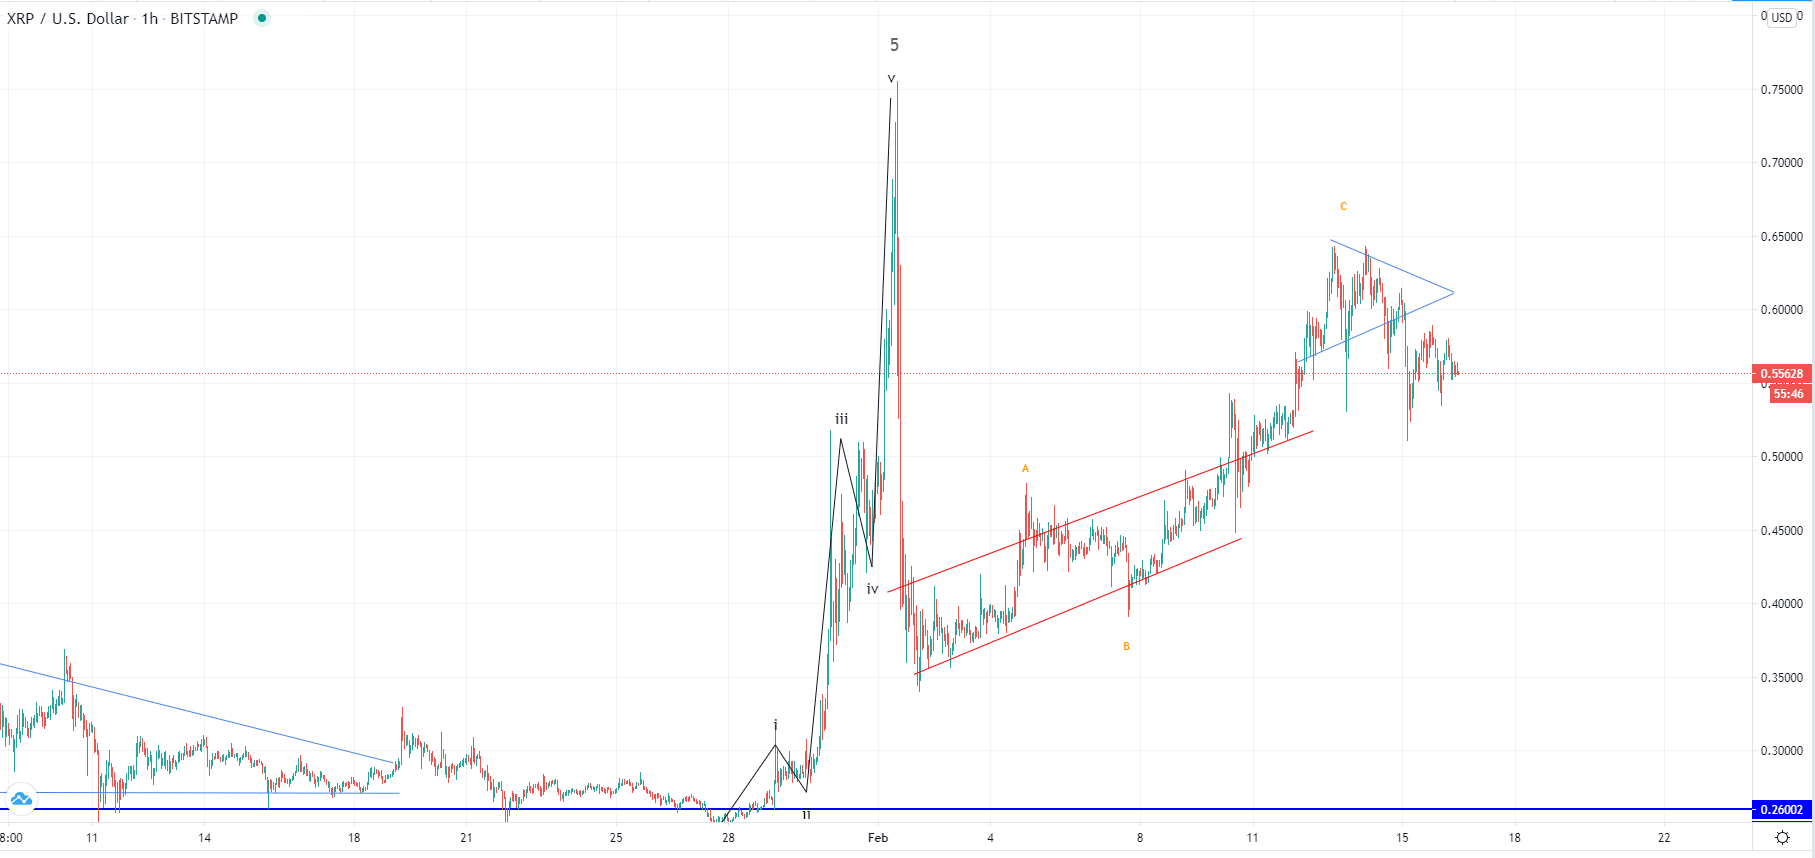 On the hourly chart, we can see that the price action made a descending structure from Saturday’s high which a retest of the ascending channels resistance level was made for support. It appears that the support was present at those levels which set the price for today’s recovery. However, it has encountered resistance again and is showing signs of weakness with the current candle indicating the continuation of the seller’s pressure.
If this structure from the start of February was the corrective ABC, now we are going to see a move to the downside in an impulsive manner. That would be the 3rd wave out of the higher degree correctional count and would mark the completion of the three-wave move from the spike made on the 1st of February. But considering the amount of decrease we’ve seen in the following day, it could have been the end of the correction in which case the current upward structure is the next starting impulse.
This is going to be validated now as if the price continues moving to the downside below the $0.5 zone it could serve as an early indication that this was indeed an ABC count to the upside. But if the price finds support here, it could result in new highs, surpassing the one made on the 1st of February.
This forecast represents FXOpen Markets Limited opinion only, it should not be construed as an offer, invitation or recommendation in respect to FXOpen Markets Limited products and services or as financial advice.
Cryptocurrency CFDs are not available to trade in all jurisdictions.
FXOpen offers the world's most popular cryptocurrency CFDs*, including Bitcoin and Ethereum. Floating spreads, 1:2 leverage — at your service. Open your trading account now or learn more about crypto CFD trading with FXOpen.
*At FXOpen UK and FXOpen AU, Cryptocurrency CFDs are only available for trading by those clients categorised as Professional clients under FCA Rules and Professional clients under ASIC Rules respectively. They are not available for trading by Retail clients.
This article represents the opinion of the Companies operating under the FXOpen brand only. It is not to be construed as an offer, solicitation, or recommendation with respect to products and services provided by the Companies operating under the FXOpen brand, nor is it to be considered financial advice.
Latest from Cryptocurrencies
Latest articles

What Order Imbalance Is and How To Use It in a Trading Strategy
Understanding the nuances of order imbalances is key for traders looking to navigate the ebb and flow of asset prices. Order imbalances provide a clear window into the supply and demand dynamics at play, offering strategic insights. This article delves

XAU/USD Gold Price Reaches an Important Resistance Zone
The XAU/USD gold chart today indicates that the historical record price of the metal is above USD 2,400 per ounce.
In addition to fears of a new round of inflation due to rising commodity prices, geopolitical tensions are

What Is a Break of Structure and How Can You Trade It?
In the ever-evolving world of Smart Money Concept (SMC) trading, a nuanced understanding of market dynamics is indispensable. This article explores the concept of Break of Structure (BOS), how to identify it, and its implications for trading strategies, setting traders