


FXOpen

BTC/USD
The price of Bitcoin has been falling downwards and made a decrease of 9.14% from Sunday’s high of $32,289 to its lowest point today at $29,336. It has broken the significant horizontal support zone and is currently interacting with the descending support level from the channel in which it was since the ending days of May.
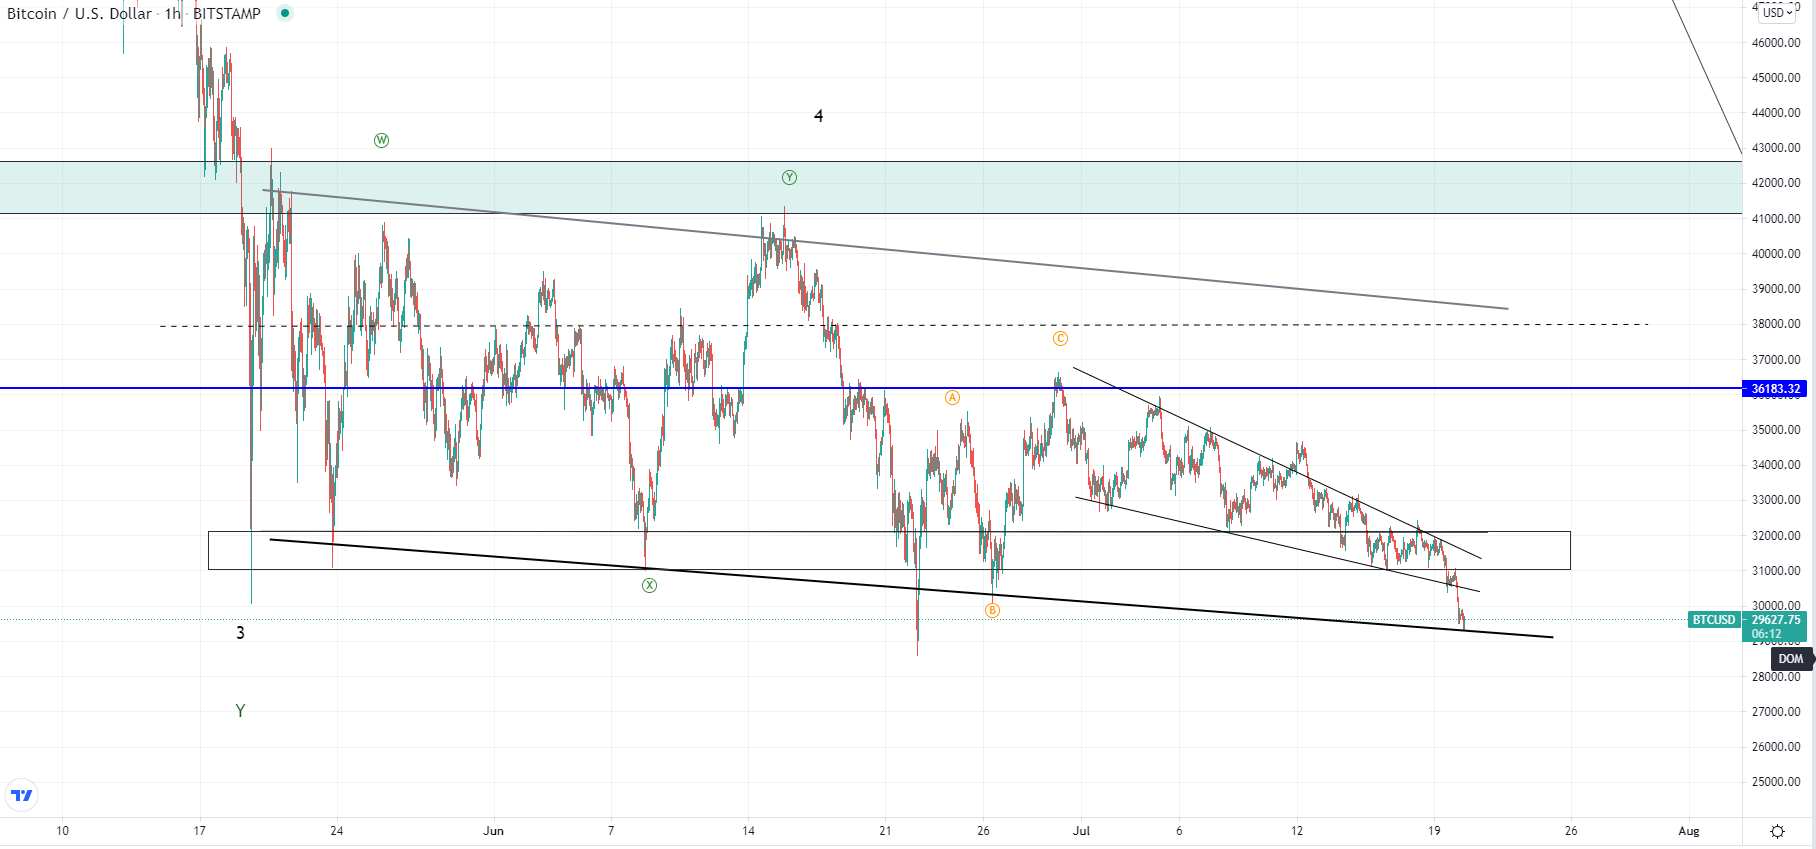
On the hourly chart, you can see that this is another downfall back to its lows of the 26th of June and is eyeing out the one on the 22nd. This downward trajectory is the continuation of the descending triangle from the start of July which was broken on the downside today. This area is still considered as support so we might see a bounce for another minor recovery but the picture still looks bearish with the price most likely headed further down in the upcoming period.
If this last descending support breaks the price will move further down and with no significant support close it could continue moving to the $18,000 zone where the next one is. This would be expected in either way but potentially these low levels would be viewed as a good buying opportunity for some, which can lead to a minor recovery first.
XRP/USD
The price of Ripple has also been in a downward trajectory and from Sunday’s high of $0.6 made a decrease of 14.21% measured to its lowest point of $0.516 around which it is currently being traded.
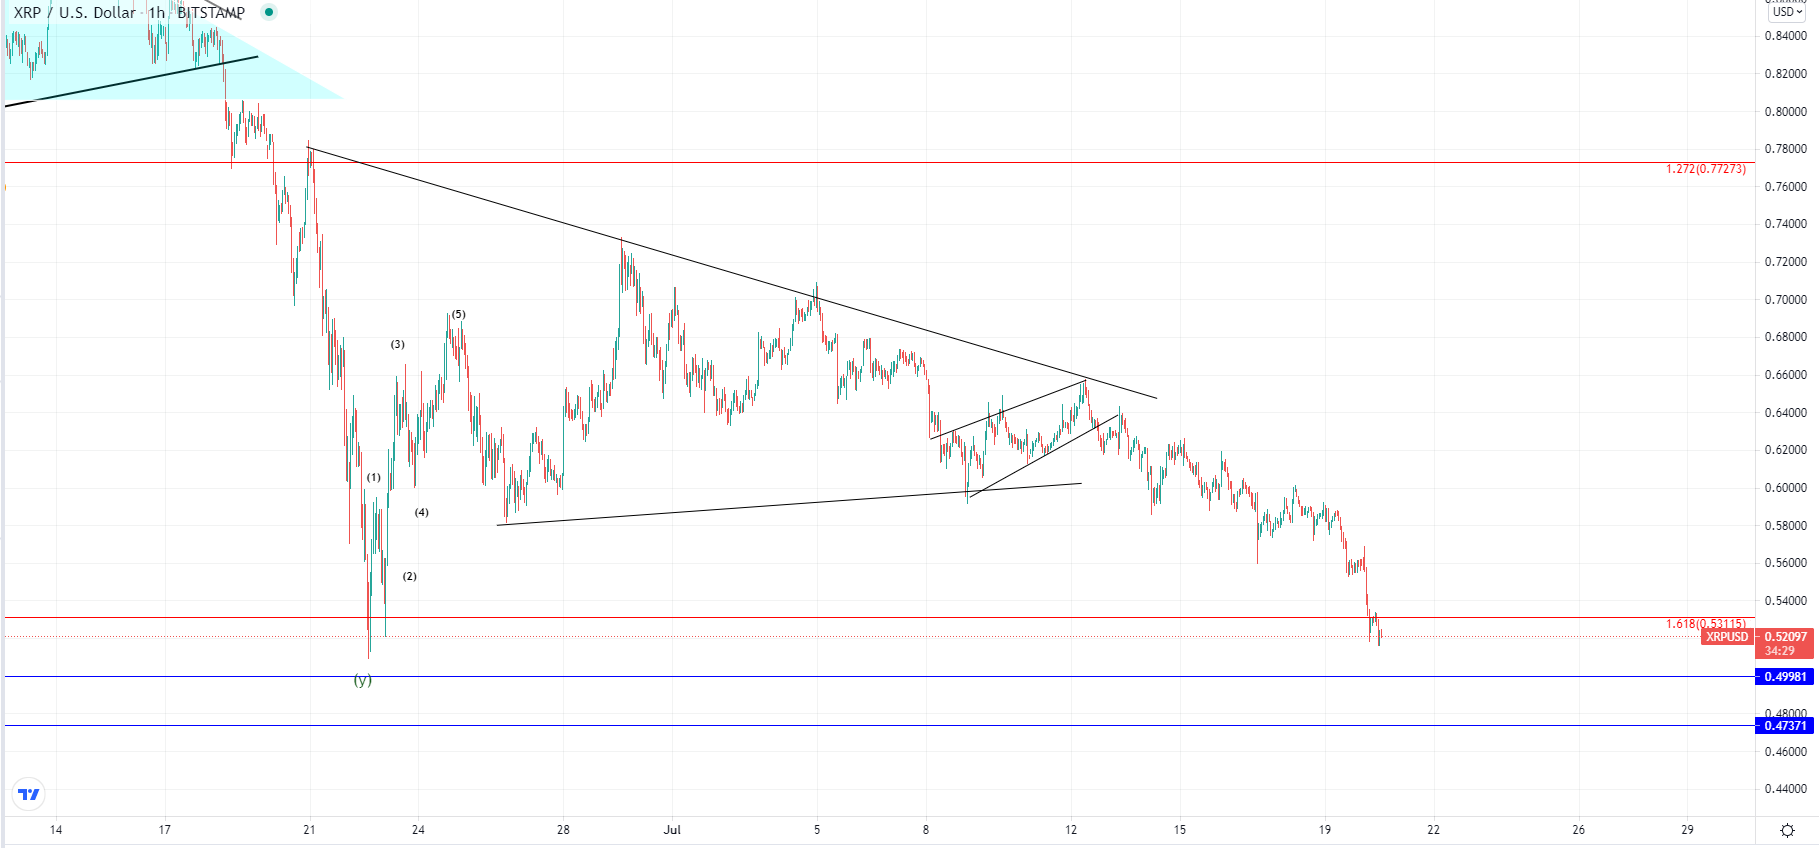 Looking at the hourly chart, we can see that the price if back on its low levels from the 22nd of June. After a slightly short-lived recovery till the start of July, another descending move was seen. This could indicate that the price has started another downtrend with the previous ascending move being corrective in nature. Another possibility could be that this is the 2nd sub-wave of the higher degree three-wave correction in which case we are to see another corrective upward move that correlates with the one till the 29th of June.
If the price finds support here and starts increasing again we are to see recovery but if it continues moving to the downside further the next zone it could stop at would be just below $0.5, making a lower low compared to the one on the 22nd of June.
This forecast represents FXOpen Markets Limited opinion only, it should not be construed as an offer, invitation or recommendation in respect to FXOpen Markets Limited products and services or as financial advice. Cryptocurrency CFDs are not available to trade in all jurisdictions.
FXOpen offers the world's most popular cryptocurrency CFDs*, including Bitcoin and Ethereum. Floating spreads, 1:2 leverage — at your service. Open your trading account now or learn more about crypto CFD trading with FXOpen.
*At FXOpen UK and FXOpen AU, Cryptocurrency CFDs are only available for trading by those clients categorised as Professional clients under FCA Rules and Professional clients under ASIC Rules respectively. They are not available for trading by Retail clients.
This article represents the opinion of the Companies operating under the FXOpen brand only. It is not to be construed as an offer, solicitation, or recommendation with respect to products and services provided by the Companies operating under the FXOpen brand, nor is it to be considered financial advice.
Latest articles

Weekly Market Wrap With Gary Thomson: S&P500, US Dollar, Gold Price, PEP Stocks
Get he latest scoop on the week's hottest headlines, all in one convenient video. Join Gary Thomson, the COO of FXOpen UK, as he breaks down the most significant news reports and shares his expert insights. Read the latest news

The Price of Silver Has Reached Its Highest Level in Over Three Years
As indicated by the XAG/USD chart today, the intraday price of silver reached $29.84 per ounce yesterday, while the previous yearly high on 12 April was $29.79. The last time this price was seen was in February

What Is the Wolfe Wave, and How Can You Trade It?
The Wolfe Waves is a powerful chart pattern recognised for analysing potential price reversals. Named after Bill Wolfe, who developed this formation through extensive trading practice, Wolfe Waves provide traders with a structured approach to anticipate market movements. In this