


FXOpen
BTC/USD
The price of Bitcoin has been moving sideways since last week as it came up to $40,000 area but then fell to $33,813 at its lowest point yesterday. This occurred after recovery and now we are seeing another minor one with the price reaching $37,486. Currently, it is being traded slightly lower but is still in an upward trajectory.
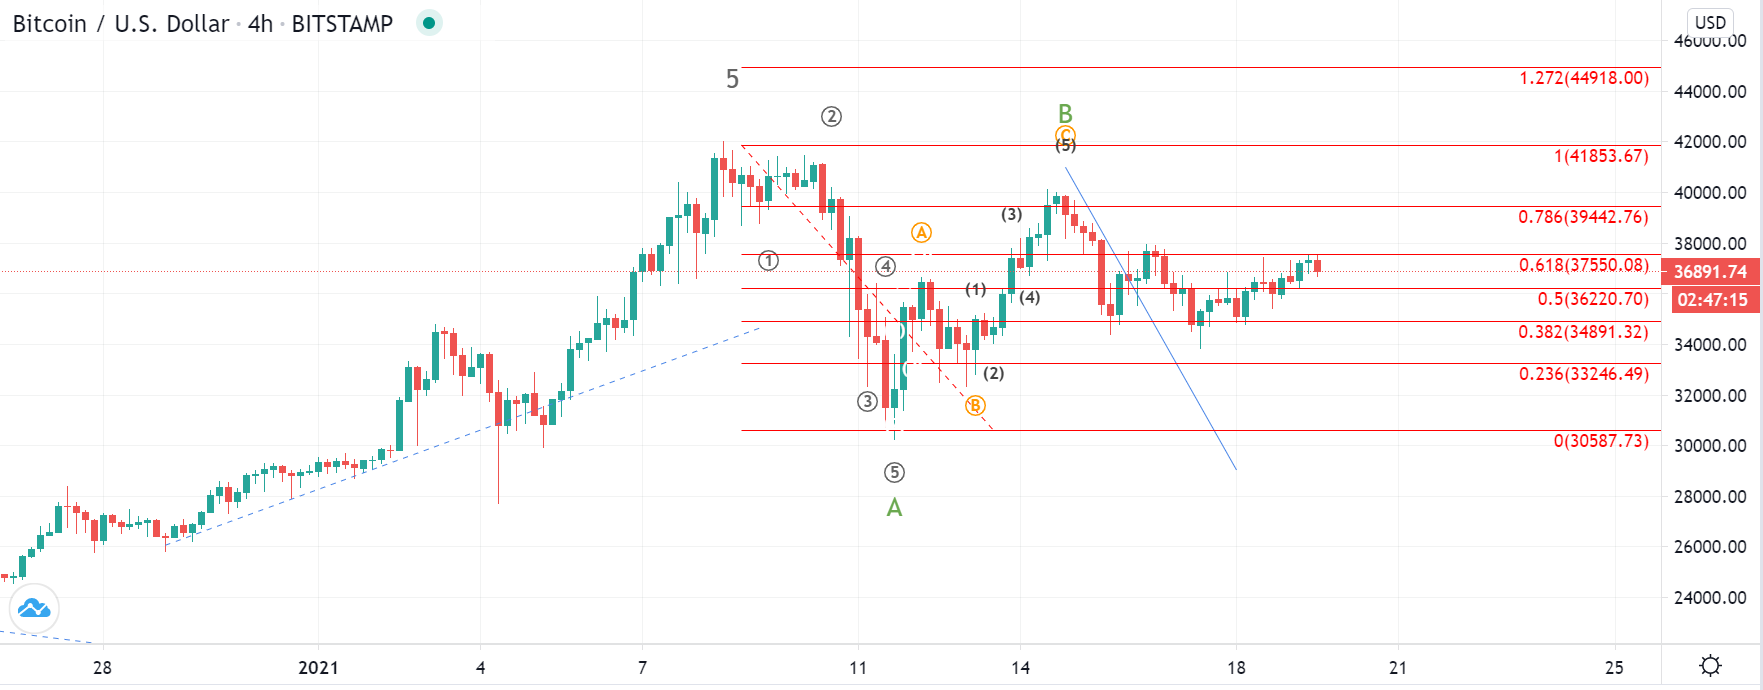
Looking at the 4 hour chart, you can see that the price made it slightly below the 0.382 Fib level on Sunday’s low but managed to pull back up above it. This could indicate that support has been found but we are still yet to see if it manages to exceed the local high at the 0.618 Fib level.
The primary scenario is one in which we are seeing an ABC correction of a higher degree and so far this has played out. The downfall below the 0.5 Fibonacci level has confirmed the previously assumed ABC to the upside which is the B wave from the higher degree count.
This is why from here we would be expecting the continuation to the downside, but that might not come as expected. The C wave which was projected to the downside should have been developing a five-wave impulse but has instead made a three-wave decrease followed by a recovery.
Now if the price continues increasing this count might get invalidated but this would potentially still be the part of the correctional count which is set to push the price lower.
XRP/USD
The price of Ripple has been increasing and came up by 13.87% from its yesterday’s low at $0.2714 to $0.309 where it is now being traded.

On the 4-hour chart, you can see that the price broke out from the descending triangle on the upside after the third interaction with the horizontal support level was made. As the price found support there we have seen a bounce that led the price for a breakout and a higher high was made compared to the previous local one.
This could be the start of the 5th wave from the five-wave impulse that started in December last year after the price made the end of the significant downside move. The price hasn’t made it inside the territory of the 1st wave which makes this scenario valid and now if we are seeing the development of the 5th wave it is set to push the price of Ripple higher then on the 7th of January where the ending point of the 3rd wave is.
FXOpen offers the world's most popular cryptocurrency CFDs*, including Bitcoin and Ethereum. Floating spreads, 1:2 leverage — at your service. Open your trading account now or learn more about crypto CFD trading with FXOpen.
*At FXOpen UK and FXOpen AU, Cryptocurrency CFDs are only available for trading by those clients categorised as Professional clients under FCA Rules and Professional clients under ASIC Rules respectively. They are not available for trading by Retail clients.
This article represents the opinion of the Companies operating under the FXOpen brand only. It is not to be construed as an offer, solicitation, or recommendation with respect to products and services provided by the Companies operating under the FXOpen brand, nor is it to be considered financial advice.
Latest articles

Weekly Market Wrap With Gary Thomson: S&P500, US Dollar, Gold Price, PEP Stocks
Get he latest scoop on the week's hottest headlines, all in one convenient video. Join Gary Thomson, the COO of FXOpen UK, as he breaks down the most significant news reports and shares his expert insights. Read the latest news

The Price of Silver Has Reached Its Highest Level in Over Three Years
As indicated by the XAG/USD chart today, the intraday price of silver reached $29.84 per ounce yesterday, while the previous yearly high on 12 April was $29.79. The last time this price was seen was in February

What Is the Wolfe Wave, and How Can You Trade It?
The Wolfe Waves is a powerful chart pattern recognised for analysing potential price reversals. Named after Bill Wolfe, who developed this formation through extensive trading practice, Wolfe Waves provide traders with a structured approach to anticipate market movements. In this