


FXOpen

BTC/USD
The price of Bitcoin has been on the rise since the 8th of June when it fell to the $31,000 zone again. From there we have seen an increase of 31% measured to its highest point yesterday at $40,750. Now it is being traded slightly lower but is still in an upward trajectory overall.
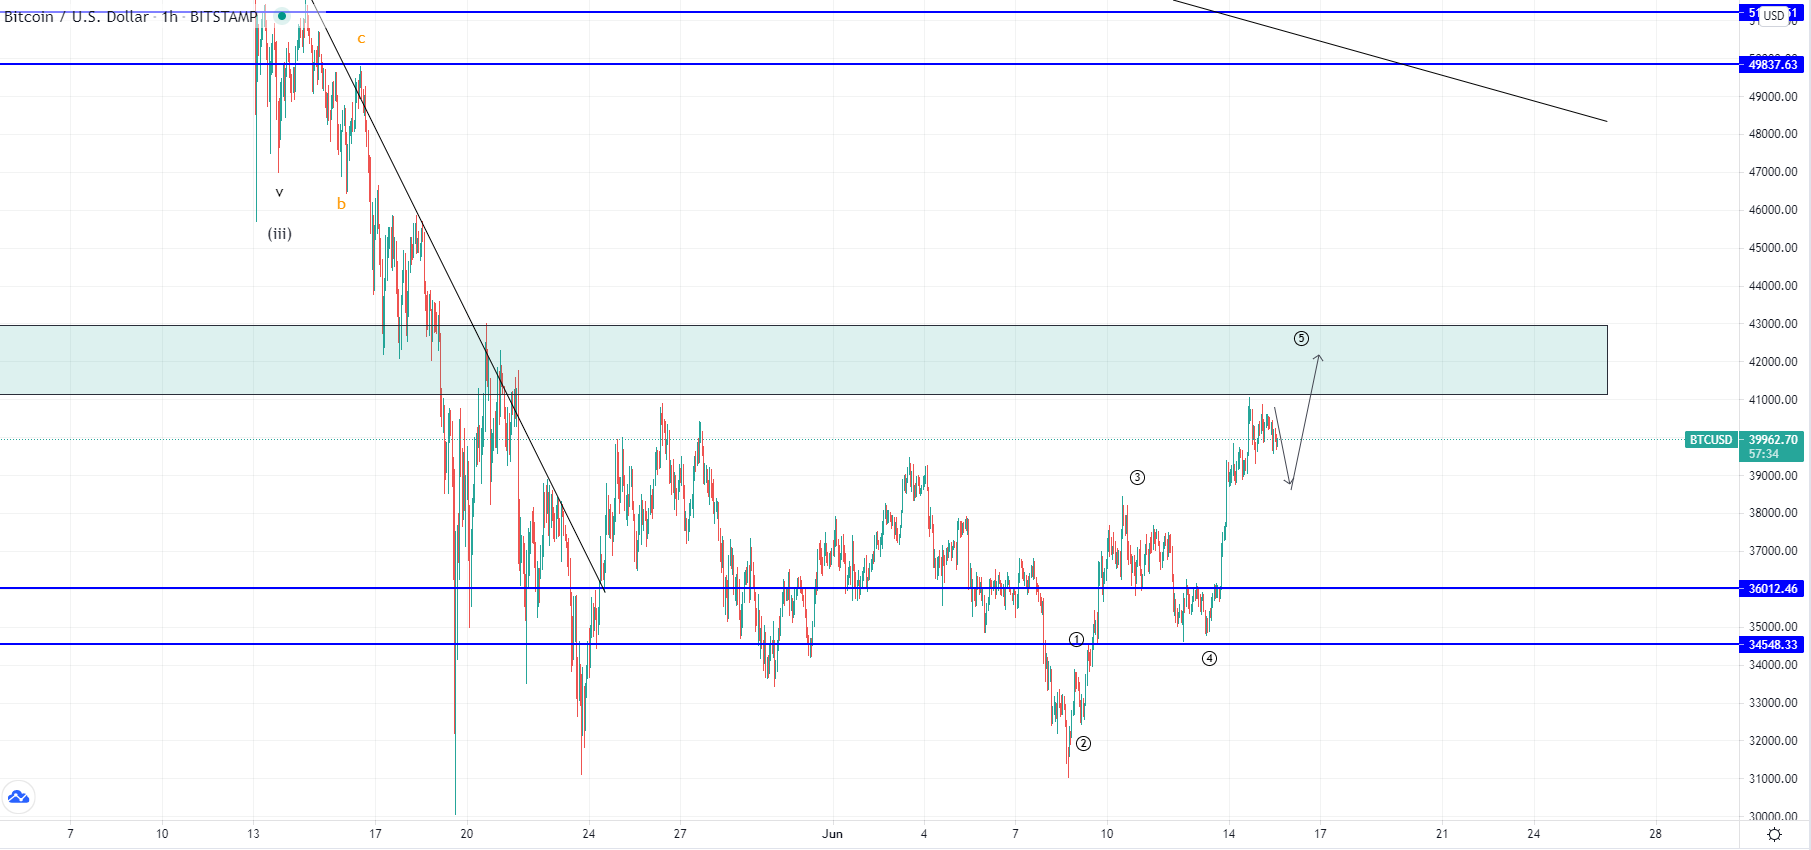 You can see that the price fell for the third time to the $31,000 zone on the 8th of June on the hourly chart. This was done in a three-wave manner from the May 26th high but also from its June 3rd high. This creates a problem in counting waves as there isn’t still a clear sign that the price bottomed out. However for now we can assume that the price found support again on the 8th after which we have seen an impulsive rise. This could be an indication that we have seen the start of a new wave to the upside which is set to recover the price more significantly.
If this is true then the price should now develop a five-wave pattern which is why a higher high from here could be expected to the vicinity of the horizontal range of $42,000. After that the 2nd wave of the higher degree count should retrace the price before a breakout above the zone.
XRP/USD
Ripple has seen a recovery of 18.5% from its low on the 8th of June when the price was sitting at $0.79 to its highest point at $0.929. Now its is being traded at $0.8819 but is looking like there is still more room to the upside.
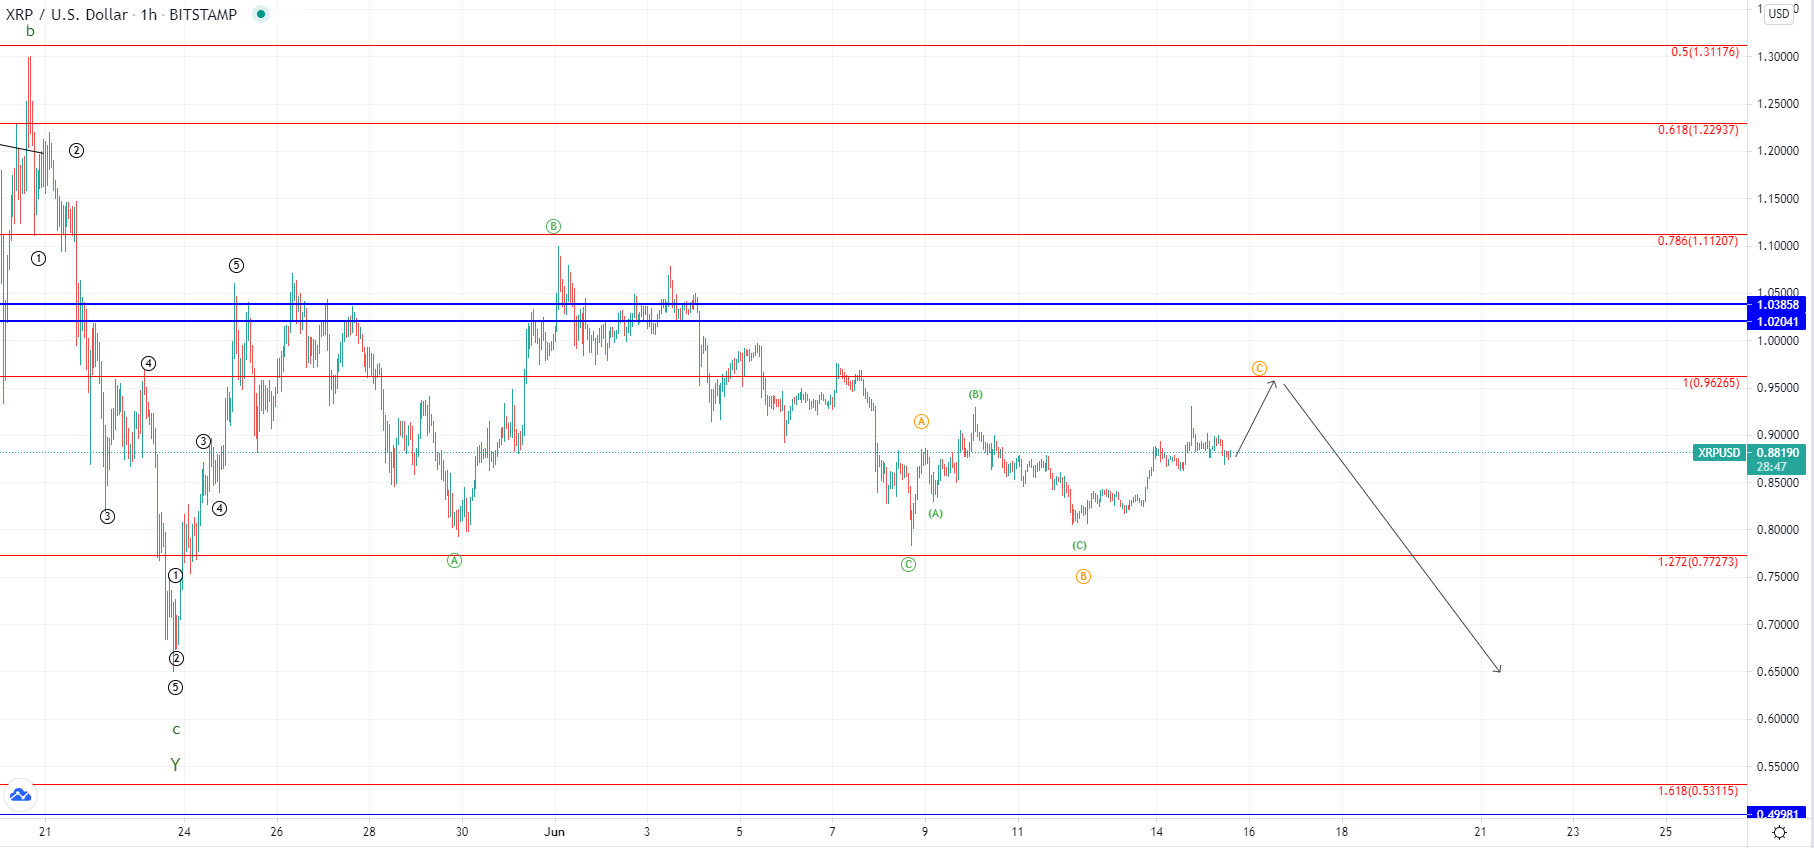 Looking at the hourly chart, we can see that the price found resistance yesterday on the prior high vicinity and made a minor retracement. A higher-high could now be seen as its fell to the support level of the horizontal range and looks like it will keep being traded above it. But the wave structure implies that this recovery could be an ABC correction to the upside after which the price could fall down below its support of the prior low at $0.8.
If the price keeps moving impulsively further to the upside and manages to go beyond $1 this scenario would look less likely.
This forecast represents FXOpen Markets Limited opinion only, it should not be construed as an offer, invitation or recommendation in respect to FXOpen Markets Limited products and services or as financial advice. Cryptocurrency CFDs are not available to trade in all jurisdictions.
FXOpen offers the world's most popular cryptocurrency CFDs*, including Bitcoin and Ethereum. Floating spreads, 1:2 leverage — at your service. Open your trading account now or learn more about crypto CFD trading with FXOpen.
*At FXOpen UK and FXOpen AU, Cryptocurrency CFDs are only available for trading by those clients categorised as Professional clients under FCA Rules and Professional clients under ASIC Rules respectively. They are not available for trading by Retail clients.
This article represents the opinion of the Companies operating under the FXOpen brand only. It is not to be construed as an offer, solicitation, or recommendation with respect to products and services provided by the Companies operating under the FXOpen brand, nor is it to be considered financial advice.
Latest from Cryptocurrencies
Latest articles

What Order Imbalance Is and How To Use It in a Trading Strategy
Understanding the nuances of order imbalances is key for traders looking to navigate the ebb and flow of asset prices. Order imbalances provide a clear window into the supply and demand dynamics at play, offering strategic insights. This article delves

XAU/USD Gold Price Reaches an Important Resistance Zone
The XAU/USD gold chart today indicates that the historical record price of the metal is above USD 2,400 per ounce.
In addition to fears of a new round of inflation due to rising commodity prices, geopolitical tensions are

What Is a Break of Structure and How Can You Trade It?
In the ever-evolving world of Smart Money Concept (SMC) trading, a nuanced understanding of market dynamics is indispensable. This article explores the concept of Break of Structure (BOS), how to identify it, and its implications for trading strategies, setting traders