


FXOpen
BTC/USD
The price of Bitcoin has fallen by 20.4% measured from its all-time high of $64,791 made on the 14th of April to its lowest wick on the 17th when the price came down to $51,531. From there we have seen a recovery to $57,702 but then again the price started falling back down and is currently being traded at around $55,980.
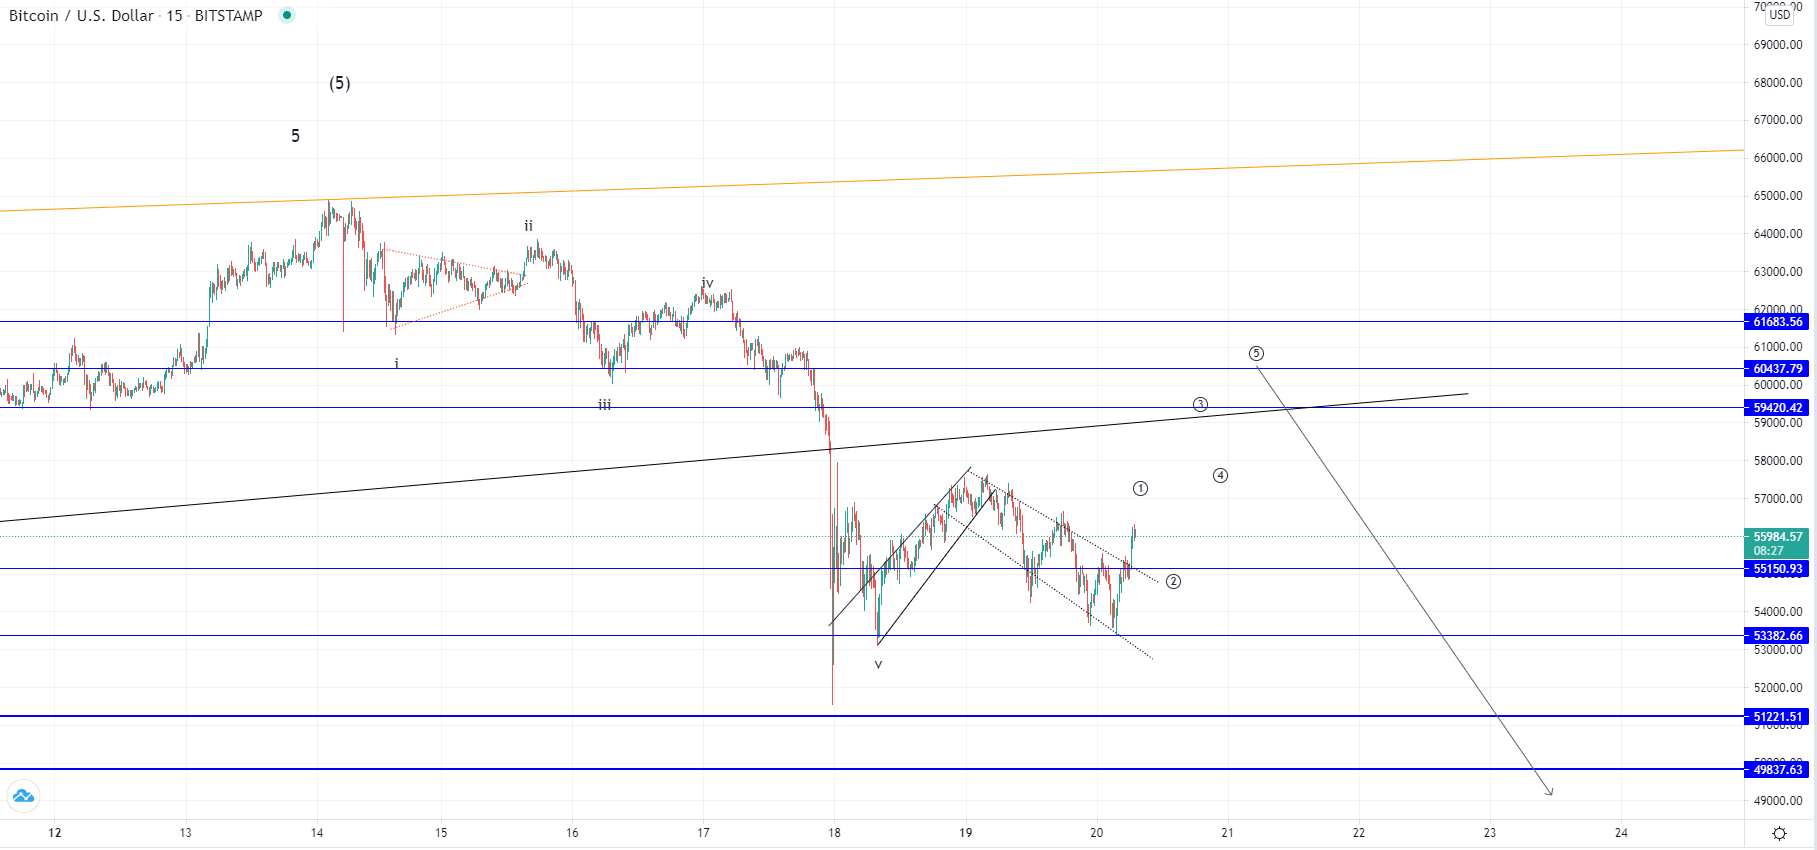
On the hourly chart, you can see that the price made the majority of its decrease on the 17th which was the 5th wave from the descending impulse. This could be the first sub-wave of the higher degree downturn that we are to see in the market.
It broke down from some of the highly significant support levels both horizontal and the ascending triangle in which it was since the 21st of February. This ascending triangle could have been the ending diagonal which marked the completion of the five-wave impulse from March last year.
This is the overdue correction that the market needed to overcome in order to continue moving to the upside and is now likely to push the price further to the downside. However, this isn’t expected in a straight line. More likely we are to see now a corrective increase and a consolidation before another impulsive move to the downside of the equally strong amount.
Potentially we could see now an ABC correction out of which we are currently seeing the development of the B wave and in the upcoming days the C wave would make a higher high compared to Monday’s one but from there further lows would be expected below the $50,000 mark.
XRP/USD
Ripple has been declining from the 14th of April when it reached $1.95 at its highest point and fell down to $1.2 at its lowest point which was a decrease of 39.7%. It made a minor recovery since and is now sitting at around $1.3.
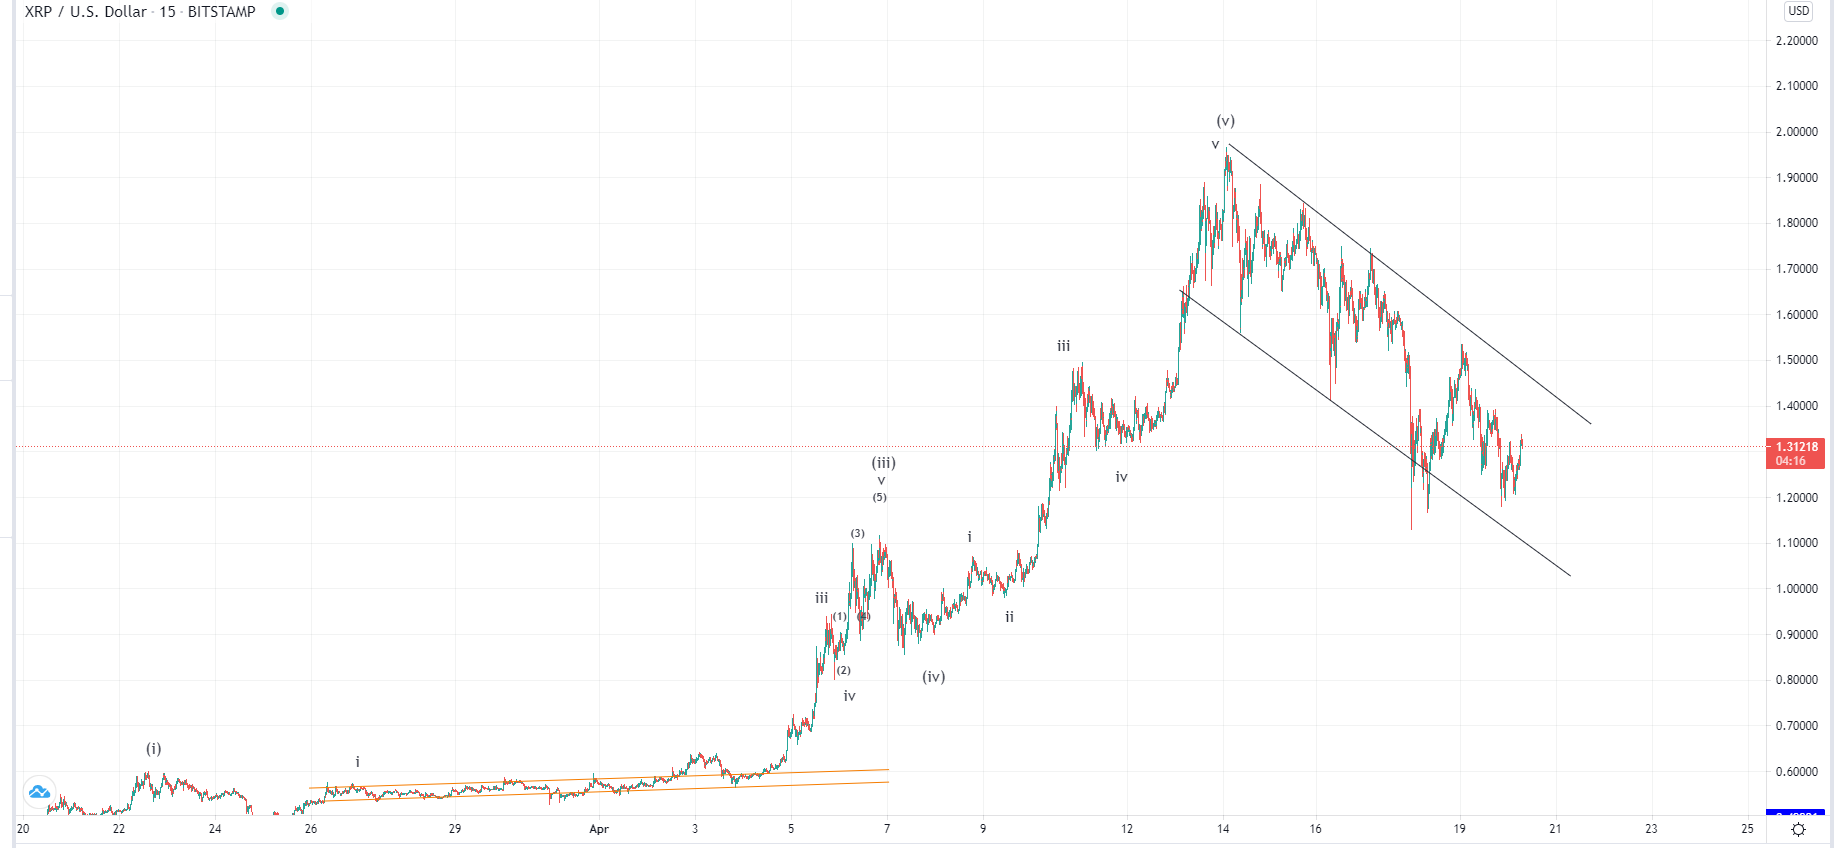
We have seen the formation of the descending channel after the price made a five-wave increase. This was the completion of the impulse wave from the 16th of March and the continuation of the breakout momentum from the symmetrical triangle. Now as the move ended we are now most likely seeing the higher degree correctional formation that is now going to continue further.
In the short-term, we could see another interaction with the channel’s resistance level and a minor recovery but the further downside would be expected potentially to $1.
This forecast represents FXOpen Markets Limited opinion only, it should not be construed as an offer, invitation or recommendation in respect to FXOpen Markets Limited products and services or as financial advice. Cryptocurrency CFDs are not available to trade in all jurisdictions.
FXOpen offers the world's most popular cryptocurrency CFDs*, including Bitcoin and Ethereum. Floating spreads, 1:2 leverage — at your service. Open your trading account now or learn more about crypto CFD trading with FXOpen.
*At FXOpen UK and FXOpen AU, Cryptocurrency CFDs are only available for trading by those clients categorised as Professional clients under FCA Rules and Professional clients under ASIC Rules respectively. They are not available for trading by Retail clients.
This article represents the opinion of the Companies operating under the FXOpen brand only. It is not to be construed as an offer, solicitation, or recommendation with respect to products and services provided by the Companies operating under the FXOpen brand, nor is it to be considered financial advice.
Latest from Cryptocurrencies
Latest articles

XAU/USD Gold Price Reaches an Important Resistance Zone
The XAU/USD gold chart today indicates that the historical record price of the metal is above USD 2,400 per ounce.
In addition to fears of a new round of inflation due to rising commodity prices, geopolitical tensions are

What Is a Break of Structure and How Can You Trade It?
In the ever-evolving world of Smart Money Concept (SMC) trading, a nuanced understanding of market dynamics is indispensable. This article explores the concept of Break of Structure (BOS), how to identify it, and its implications for trading strategies, setting traders

Hong Kong Stocks Become Top Risers After Wild Ride Subsides
Hong Kong enjoyed a sterling reputation for an entire century as a highly polished, utterly stable mantlepiece upon which global corporations could comfortably sit and where an international talent base could reside in fabulous surroundings and approach European, American, African