


FXOpen
BTC/USD
The price of Bitcoin has been on a decline since the 15th of June when it was trading at $41,151 at its highest point. From there we have seen a decrease of 24.5% measured to its lowest point today at around $31,240. Now the price is slightly higher but is currently testing the horizontal support level from the 23rd of May.
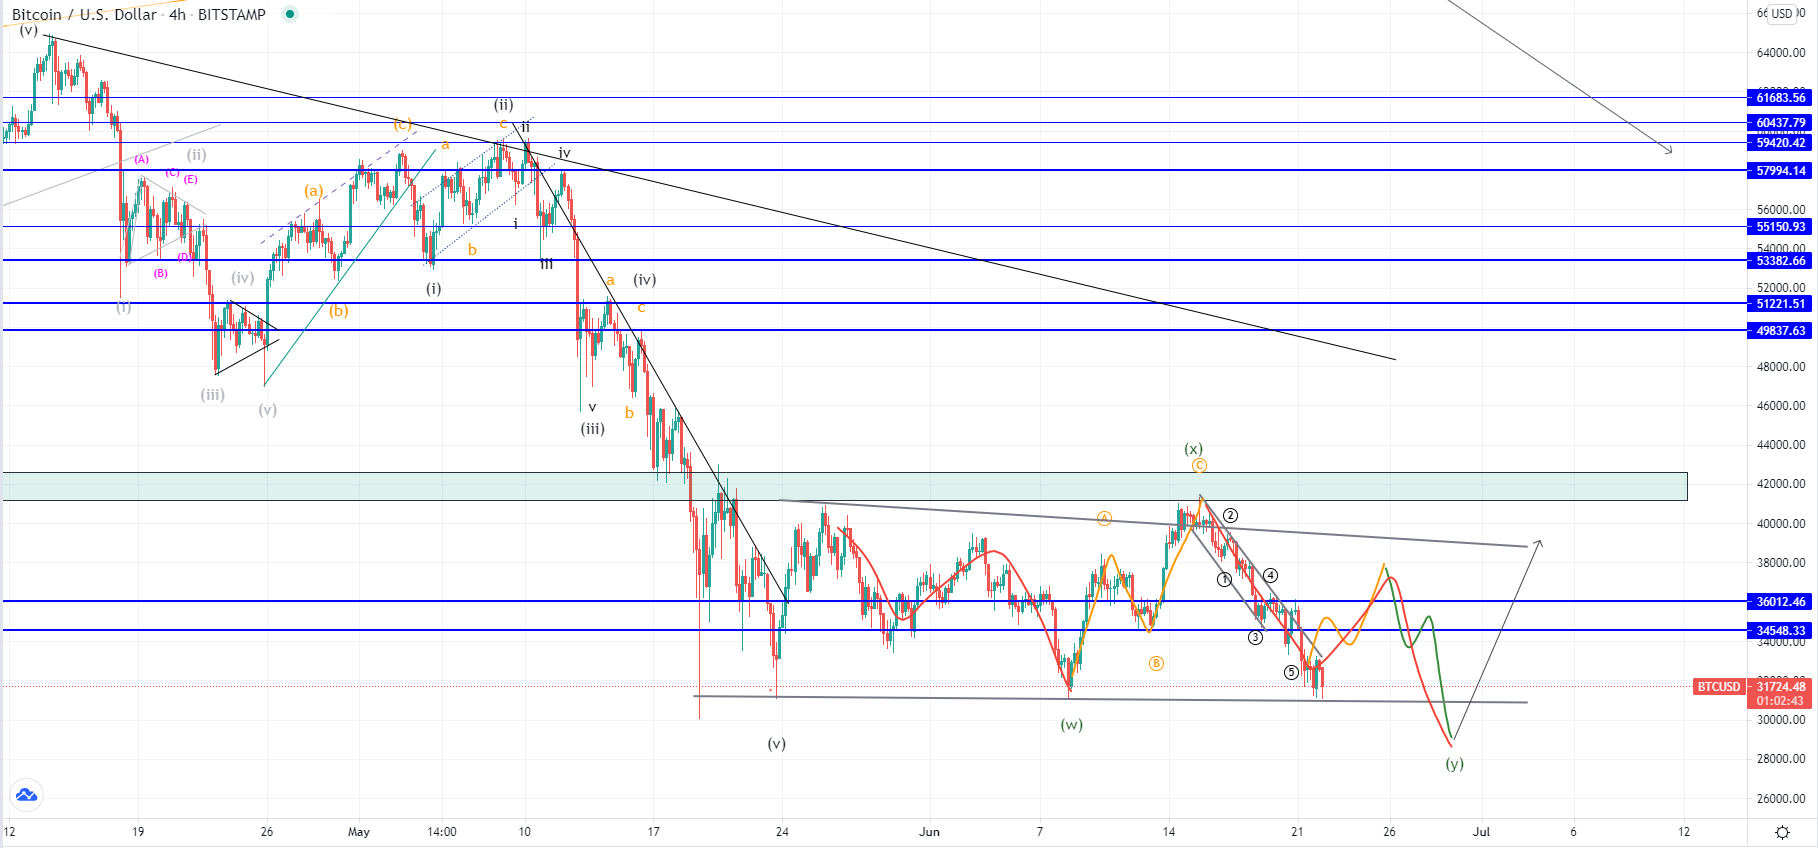
On the 4-hour chart, we can see that this is the third time the price has been trading on its lower level of the horizontal range that formed from the 23rd of May. But doing so it weakened the level which is why it potentially won’t hold for much longer. However, the wave structure implies that we might see a recovery shortly at least as the 2nd sub-wave of the next three-wave correction to the downside after which we could see a larger recovery.
From here a breakout to the downside isn’t so likely but rather the price could now find another support here and bounce but only for a lower high compared to the one on the 15th of June. Another possibility would be that from the 8th till the 15th of June we have seen the 3rd wave out of the higher degree correction with its first wave being the upward move from the 23rd till the 26th of May. In that case, the price could continue its downside trajectory but also in the near term a move to the upside would now be expected.
XRP/USD
The price of Ripple has been on a decline as well from its highest point on the 14th of June when it came up to $0.93 and fell down by 39% measured to its lowest point to $0.567. Now the price is still in a downward trajectory but it is starting to stabilize.
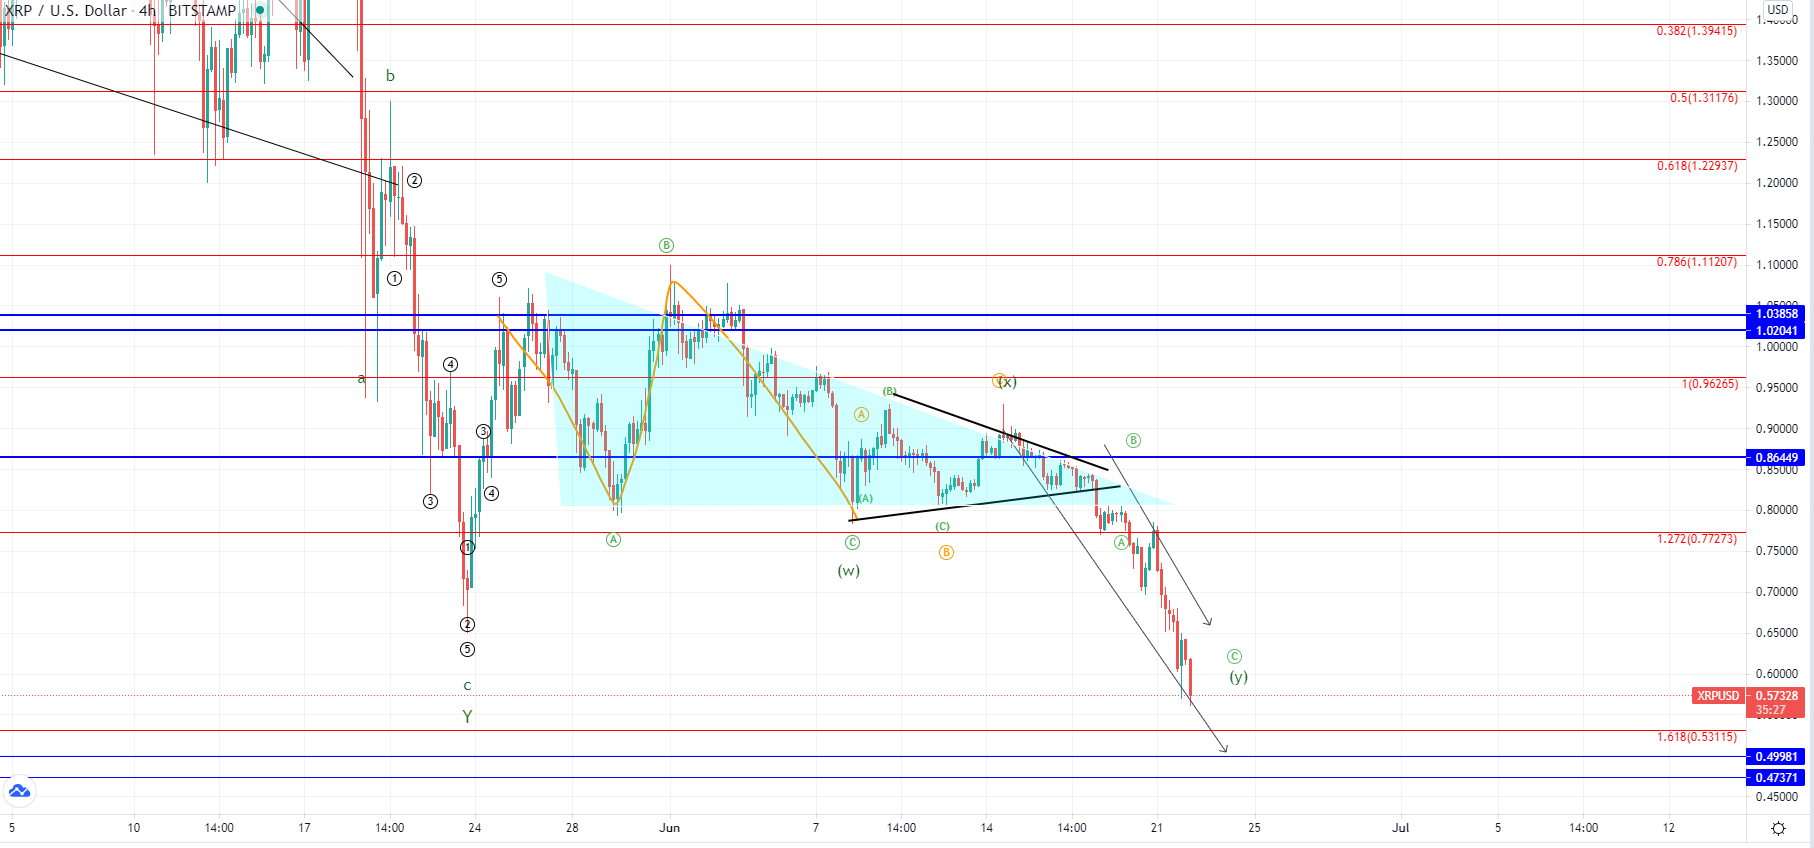
Looking at the 4-hour chart, we can see that this downfall was the breakout from the descending triangle in which the price was since the 26th of May. We have seen an impulsive move to the downside. Now as the price approaches its significant horizontal support zone it might continue to the $0.5 area and then look for support there. If it finds support there and it likely would a recovery would be seen. Considering the significance of the $0.8 level this would be the first target to the upside.
This forecast represents FXOpen Markets Limited opinion only, it should not be construed as an offer, invitation or recommendation in respect to FXOpen Markets Limited products and services or as financial advice. Cryptocurrency CFDs are not available to trade in all jurisdictions.
FXOpen offers the world's most popular cryptocurrency CFDs*, including Bitcoin and Ethereum. Floating spreads, 1:2 leverage — at your service. Open your trading account now or learn more about crypto CFD trading with FXOpen.
*At FXOpen UK and FXOpen AU, Cryptocurrency CFDs are only available for trading by those clients categorised as Professional clients under FCA Rules and Professional clients under ASIC Rules respectively. They are not available for trading by Retail clients.
This article represents the opinion of the Companies operating under the FXOpen brand only. It is not to be construed as an offer, solicitation, or recommendation with respect to products and services provided by the Companies operating under the FXOpen brand, nor is it to be considered financial advice.
Latest articles

Anchored VWAP and How You Can Use It in Forex Trading
In the world of forex trading, understanding the nuanced tools at your disposal can significantly enhance decision-making processes. One such sophisticated tool is the Anchored Volume-Weighted Average Price (Anchored VWAP), which refines the standard VWAP by allowing traders to set

META Share Price Collapses after Publication of Quarterly Report
Just yesterday, META's stock price closed at USD 493.50, up approximately 40% since the start of 2024 and up nearly 300% since the start of 2023.
However, following the release of Meta's quarterly report, its shares plummeted to USD

USD/JPY Analysis: The Rate Exceeds The Level of 155 Yen Per US Dollar
Today, the price of USD/JPY once again renewed its 34-year high, exceeding the level of 155 yen per dollar, which put pressure on the current authorities.
According to Reuters, officials are trying to maintain calm in the market.
"We