


FXOpen
BTC/USD
The price of Bitcoin has been on a decline from yesterday’s high at $59,000 and has made a 6.69% decrease measured to its lowest point today at $55.084. Now it is sitting slightly higher but is again looking like its struggling to keep up the recovery.
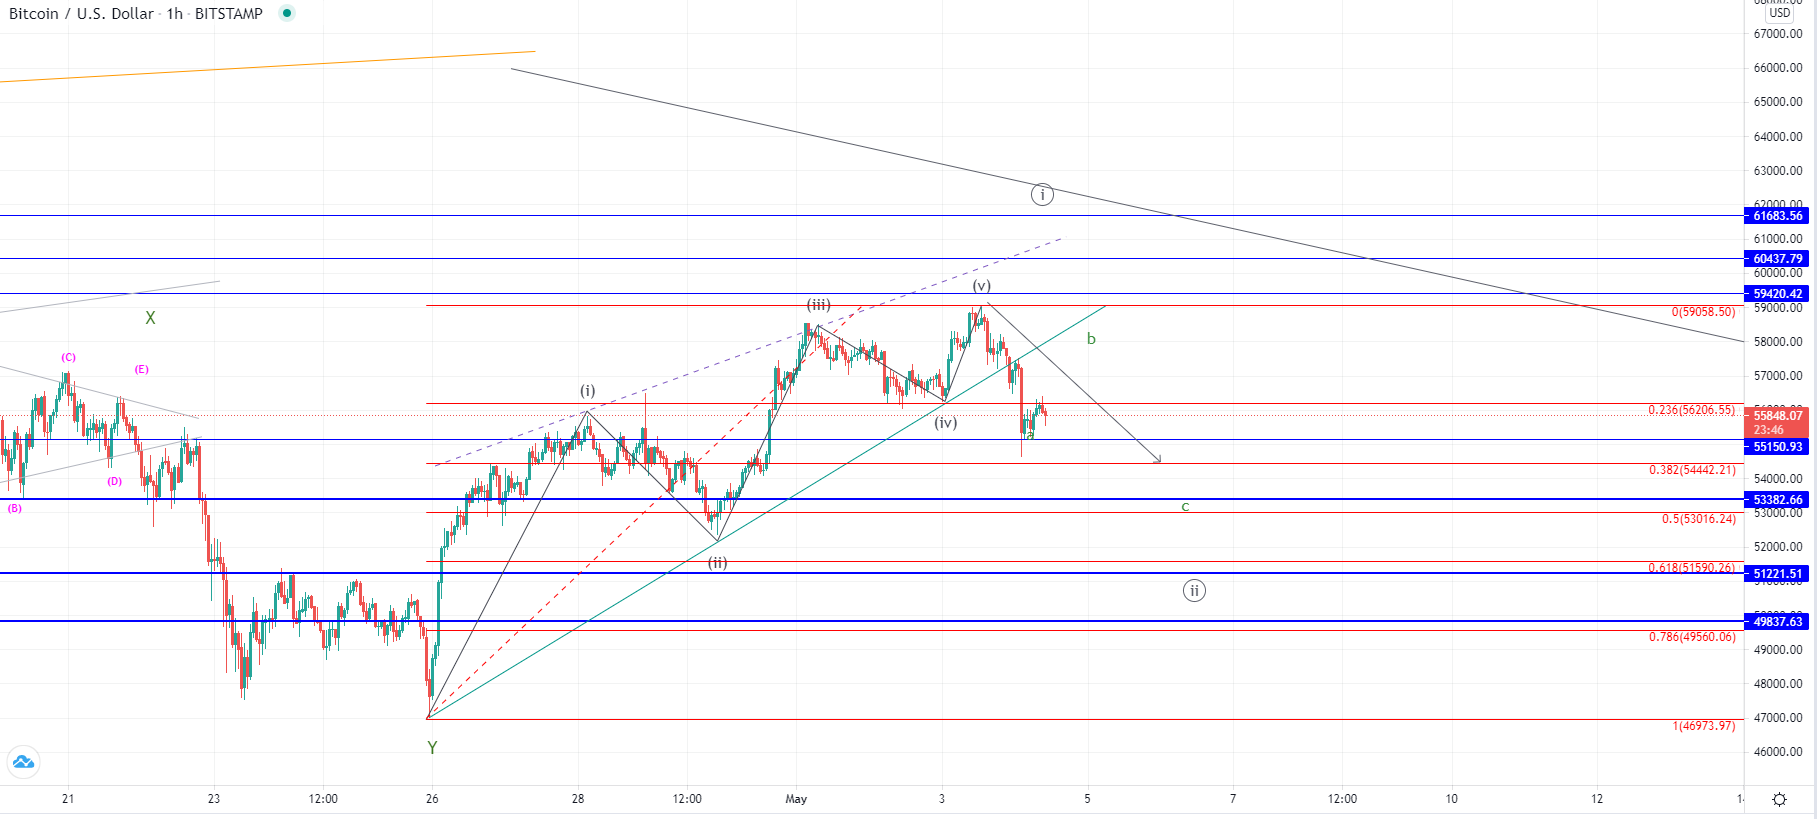
On the hourly chart, you can see that the price of Bitcoin was on the rise since the 26th of April when an ascending triangle was made. Yesterday, we saw a breakout to the downside from the triangles support, which could imply that this ascending move ended as the five-wave increase. If this is true then the five-wave move was most likely a leading diagonal from the next impulsive move to the upside as the previous correction of the higher degree ended.
Now we could be seeing the 2nd sub-wave of the next move to the upside which would retrace the price of Bitcoin to around $53,000 area most optimally where the 0.5 Fibonacci level is. This Fib level is standing in the vicinity of the significant horizontal support at $53,300 which might hold the price, but we could see the price going further down to the $51,221 area where the next one is.
After this retracement ends, according to the primary count, we are to see further uptrend continuation and new highs for Bitcoin.
XRP/USD
Ripple has been on the rise since the 26th as well and made an increase of 73.6%, coming from $0.9519 to $1.662 at its highest point on Sunday. From there we have started seeing a retecement and the price is currently sitting at $1.432.
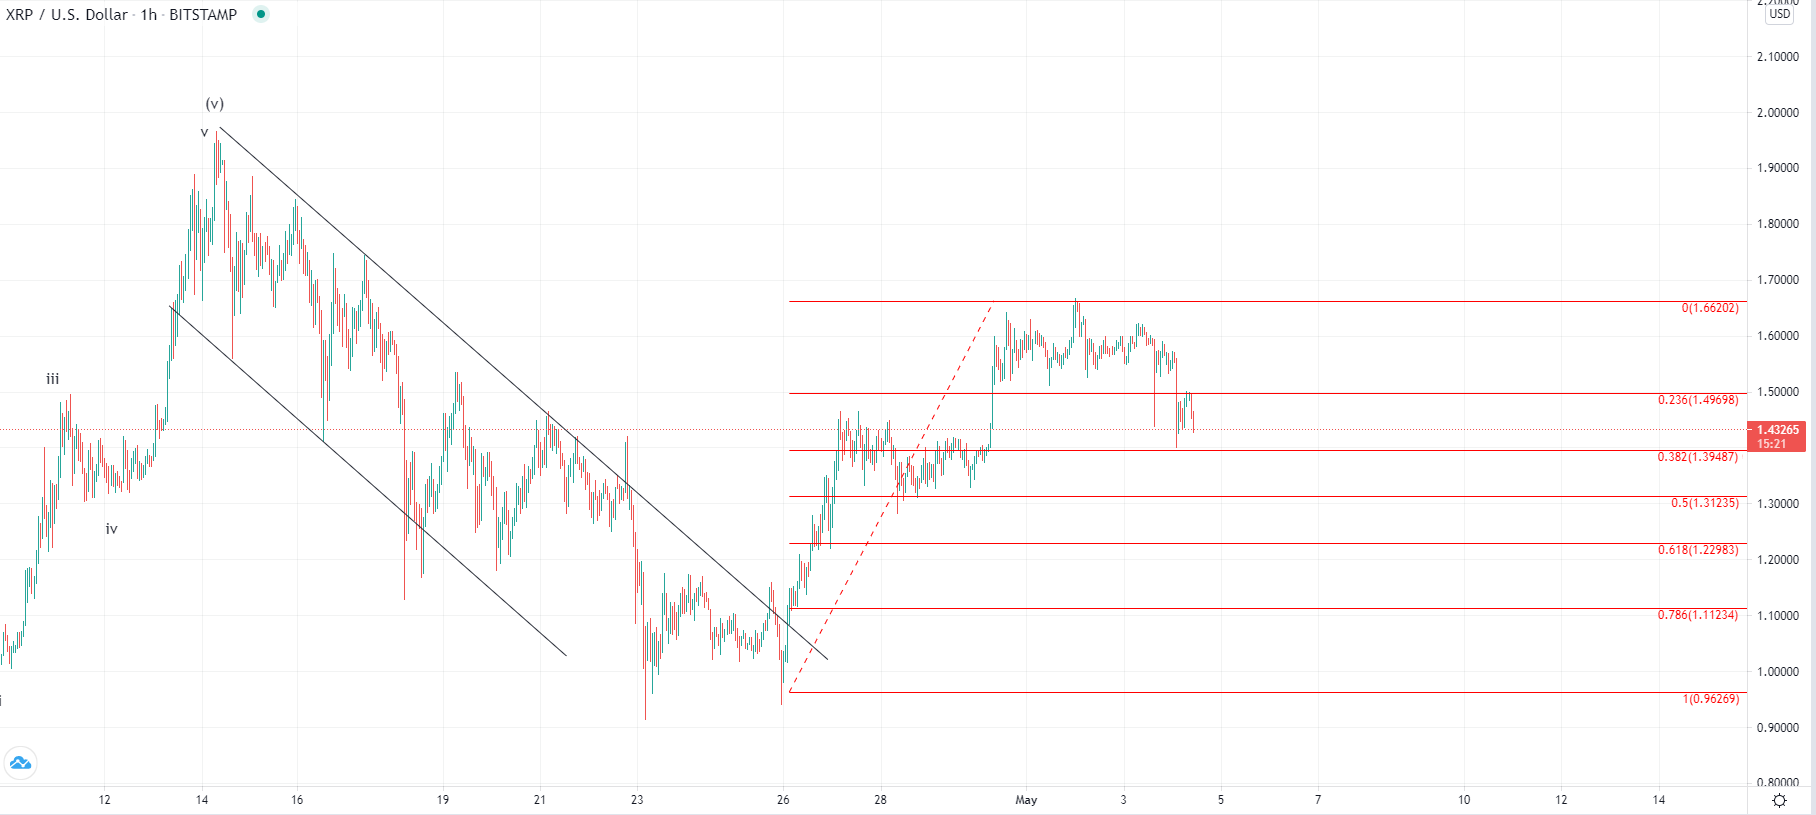
The increase seen from the 26th was a breakout from the descending channel in which it was from the 14th of April. This could imply that we have seen the completion of the corrective move and that a new wave to the upside is under development. If this is true, further uptrend continuation would be expected after the current retracement ends, but it is still unclear where the price could land on the current descending move. If this is the 2nd sub-wave of the next five-wave impulse we could see the price coming back to the 0.618 Fib level at around $1.229 or slightly higher at the 0.5 Fib level.
Another possibility could be that the retest of the 0.382 Fib level is going to come after which the price is immediately headed further up but that local correction would end up very shallow which usually isn’t the case with the 2nd wave.
This forecast represents FXOpen Markets Limited opinion only, it should not be construed as an offer, invitation or recommendation in respect to FXOpen Markets Limited products and services or as financial advice. Cryptocurrency CFDs are not available to trade in all jurisdictions.
FXOpen offers the world's most popular cryptocurrency CFDs*, including Bitcoin and Ethereum. Floating spreads, 1:2 leverage — at your service. Open your trading account now or learn more about crypto CFD trading with FXOpen.
*At FXOpen UK and FXOpen AU, Cryptocurrency CFDs are only available for trading by those clients categorised as Professional clients under FCA Rules and Professional clients under ASIC Rules respectively. They are not available for trading by Retail clients.
This article represents the opinion of the Companies operating under the FXOpen brand only. It is not to be construed as an offer, solicitation, or recommendation with respect to products and services provided by the Companies operating under the FXOpen brand, nor is it to be considered financial advice.
Latest articles

Moderna goes AI and experiences share price rally
It has been a few years now since the word Moderna was heard, or read, several times per day and as with many periods of time in which a previously headline-dominating phenomenon subsides, the pharmaceutical giant's seemingly continuous media coverage

USD to CAD Analytical Predictions in 2024, 2025 and Beyond
This comprehensive article delves into the intricacies of the USD to CAD exchange rate, exploring the factors that may influence its trajectory in 2024, 2025, and beyond. From economic outlooks to key market drivers, this article provides valuable insights for

France Joins European Stock Boom as CAC 40 Index Heads for Highs
This decade has been full of market-disrupting surprises, placing it as completely different to any other decade experienced by residents of Western Europe and North America since the end of the Second World War.
The only constant dynamic since the