


FXOpen

BTC/USD
The price of Bitcoin has reached it’s highest point this year yesterday, coming to $10163 but since then made a minor retracement of around 4.3% as it fell to $9726 at it’s lowest point today. Currently, the price is being traded at around $9774 which is slightly higher then it’s lowest point today and is hovering around those levels most likely retesting it’s support.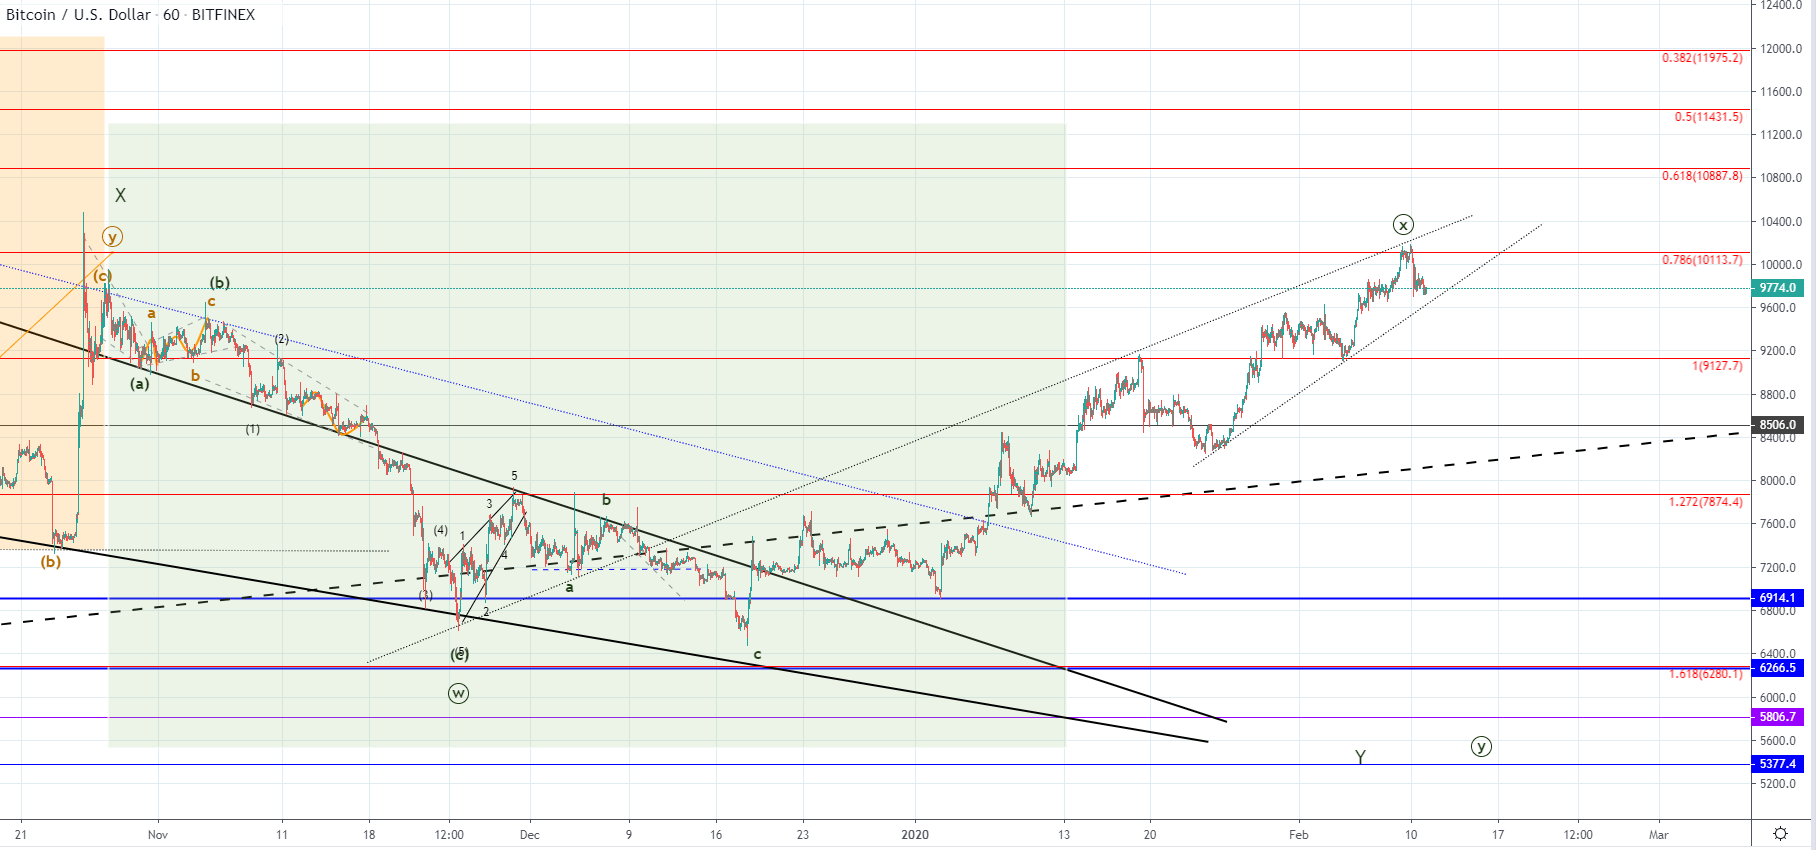
On the hourly chart, you can see that the price reached the same levels as the impulsive spike to the upside made on the 26th of October last year which is at the 0.786 Fibonacci level which served as a strong resistance point. Now the level repelled the price again which is why we have seen a minor retracement but if this was the end of the increase that started from the begging of the year the price could be headed further to the downside.
As you can see the price action started forming an ascending triangle of some kind with its apex coming above the 0.786 Fibonacci level and potentially to the next one at $10887 which is why we could see another increase to those levels before the pattern’s completion. This means that another increase might occur before the expected downturn which is set to push the price of Bitcoin for a retracement of a higher degree potentially again below $8000.
XRP/USD
Ripple has decreased by 6.64% today as it came from $0.2873 at it’s highest point yesterday to $0.26830 at it’s lowest today. The price is still being traded around the levels of today’s low and is retesting its vicinity for support.
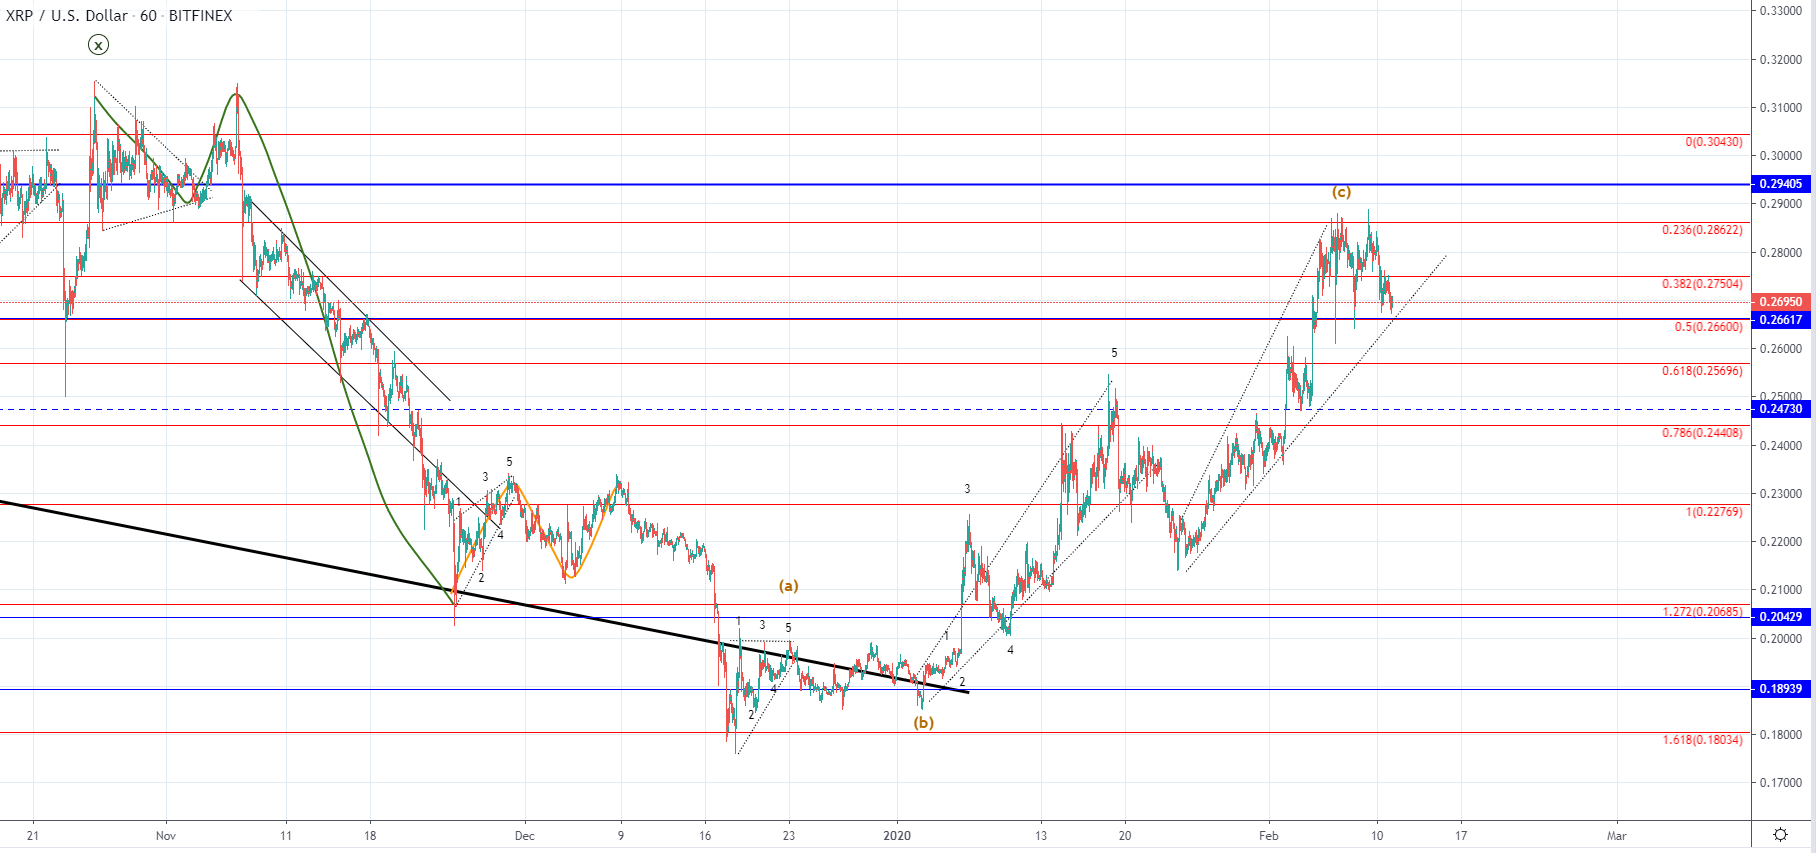
Looking at the hourly chart, you can see that the price has come above the significant horizontal level at $0.26617 last Wednesday and managed to stay there over the last week but has now come back to retest it for support. This minor retracement has been made at the intersection with the mentioned horizontal level and the lower ascending trendline which is presumed to be the support level of the ascending channel which started forming from the 24th of January.
If the ascending channel is broken on the downside the price of Ripple will be set into a retracement of a higher degree most likely below the 0.26617 horizontal level and potentially to around the 0.786 Fibonacci one which will serve as the first support point to the downside. But if the price finds support at the 0.26617 horizontal level and interaction with the next significant one could be expected which would bring the price of Ripple close to $0.3.
FXOpen offers the world's most popular cryptocurrency CFDs*, including Bitcoin and Ethereum. Floating spreads, 1:2 leverage — at your service. Open your trading account now or learn more about crypto CFD trading with FXOpen.
*At FXOpen UK and FXOpen AU, Cryptocurrency CFDs are only available for trading by those clients categorised as Professional clients under FCA Rules and Professional clients under ASIC Rules respectively. They are not available for trading by Retail clients.
This article represents the opinion of the Companies operating under the FXOpen brand only. It is not to be construed as an offer, solicitation, or recommendation with respect to products and services provided by the Companies operating under the FXOpen brand, nor is it to be considered financial advice.
Latest articles

Anchored VWAP and How You Can Use It in Forex Trading
In the world of forex trading, understanding the nuanced tools at your disposal can significantly enhance decision-making processes. One such sophisticated tool is the Anchored Volume-Weighted Average Price (Anchored VWAP), which refines the standard VWAP by allowing traders to set

META Share Price Collapses after Publication of Quarterly Report
Just yesterday, META's stock price closed at USD 493.50, up approximately 40% since the start of 2024 and up nearly 300% since the start of 2023.
However, following the release of Meta's quarterly report, its shares plummeted to USD

USD/JPY Analysis: The Rate Exceeds The Level of 155 Yen Per US Dollar
Today, the price of USD/JPY once again renewed its 34-year high, exceeding the level of 155 yen per dollar, which put pressure on the current authorities.
According to Reuters, officials are trying to maintain calm in the market.
"We