


FXOpen
BTC/USD
Last Monday the price of Bitcoin was sitting at around $10446 level which was an interaction with the 0.236 Fibonacci level after an attempt for a breakout from the descending triangle. As the price failed to breakout out from the triangle and instead got rejected by its horizontal resistance found slightly below the 0.382 Fibonacci level we have seen a decrease to $9985 at its lowest point last Wednesday.
From there another attempt is being made for a breakout to the upside but the price is currently stuck in a cluster between the 0.236 Fibonacci level and the triangle’s resistance which has been broken and serves as support. Currently the price is being traded at $10231 which is only 1.53% lower from yesterday’s open and with the price managing to hold above the triangle’s resistance we might see another attempt for a breakout to the upside.
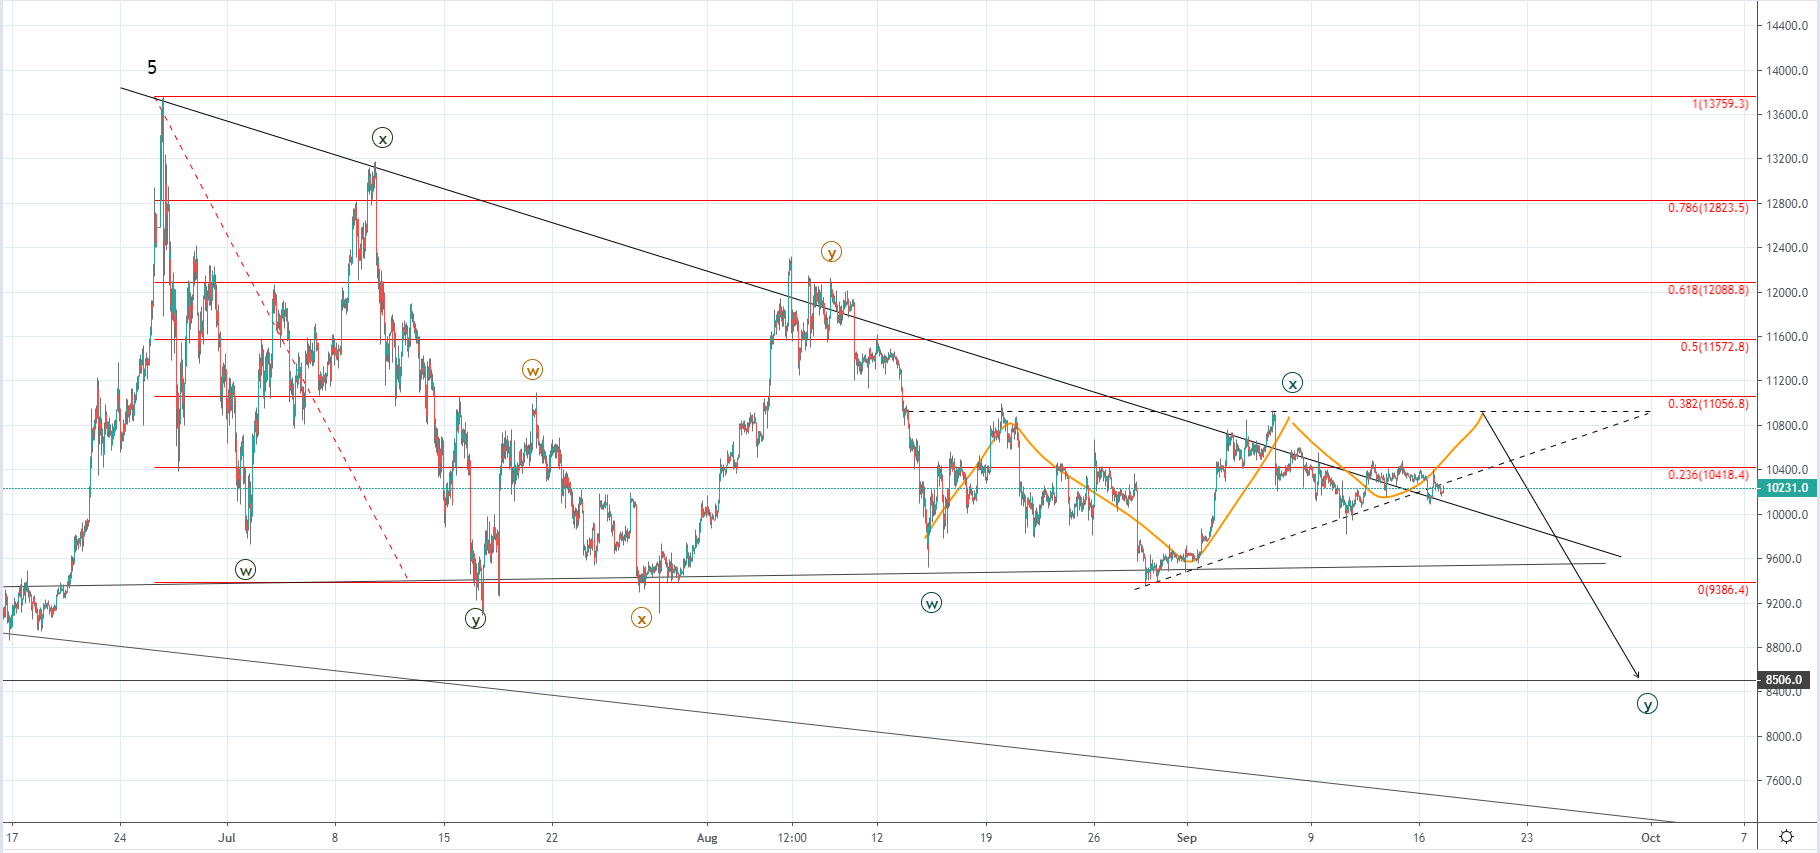 Looking at the hourly chart, we can see that the attempt for a breakout to the upside could have started as the price has gone above the triangle’s resistance and has been retesting it for support since last Thursday but there aren’t any signs of a bullish momentum needed for a breakout confirmation. As from the yearly high, we’ve seen two WXY corrections the current structure is most likely the third which would be the third wave of a higher degree correction. If this is true then we are to see a breakout to the downside from the descending triangle with a potential bull trap developing as the X wave from the last WXY correction to the downside develops in a five-wave manner in which case the Z wave could bring the price to its last horizontal resistance level again.
Projecting the length of the W wave on to the significant horizontal resistance level slightly below the 0.382 Fib level the $8500 level comes up as the potential price target for the completion of the Y wave after which we could see the uptrend continuation as the higher degree three-wave correction would be completed.
XRP/USD
From yesterday’s low at $0.2576 the price of Ripple has increased by 6.73% as it’s currently being traded at $0.27495 and is in an upward trajectory. Last week the price of Ripple has been stuck in a horizontal range between the horizontal resistance at $0.26617 and the 0.2526 support but today we’ve seen a breakout to the upside.
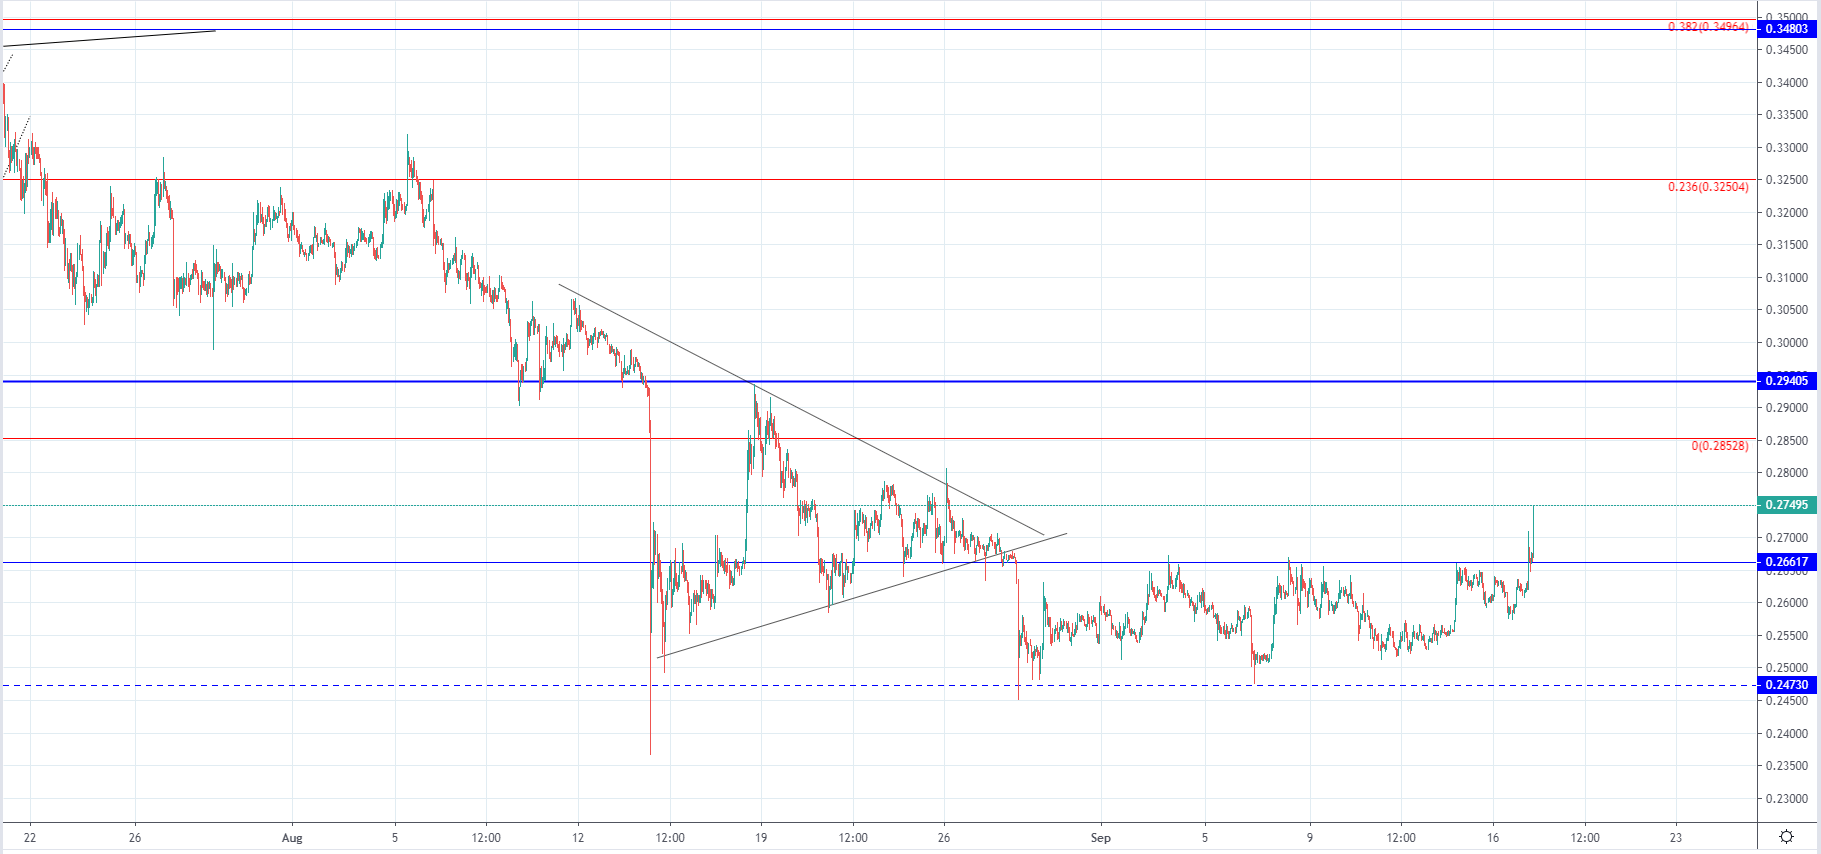 On the hourly chart, you can see that the momentum behind the increase looks strong and with the price breaking its significant horizontal resistance. The price increase is likely to continue for a bit more until it reaches its upper horizontal resistance around the $0.27843 or the next one at $0.29405. After the increase ends I would be expecting a retracement back to the broken horizontal resistance as a retest of support and if the price manages to hold above it, it could indicate the start of the recovery. But if the price fails to hold above it and instead enters the lower range it would more likely mean that the increase seen was corrective and that the downtrend would continue for another lower low before a recovery can be made.
FXOpen offers the world's most popular cryptocurrency CFDs*, including Bitcoin and Ethereum. Floating spreads, 1:2 leverage — at your service. Open your trading account now or learn more about crypto CFD trading with FXOpen.
*At FXOpen UK and FXOpen AU, Cryptocurrency CFDs are only available for trading by those clients categorised as Professional clients under FCA Rules and Professional clients under ASIC Rules respectively. They are not available for trading by Retail clients.
This article represents the opinion of the Companies operating under the FXOpen brand only. It is not to be construed as an offer, solicitation, or recommendation with respect to products and services provided by the Companies operating under the FXOpen brand, nor is it to be considered financial advice.
Latest articles

Anchored VWAP and How You Can Use It in Forex Trading
In the world of forex trading, understanding the nuanced tools at your disposal can significantly enhance decision-making processes. One such sophisticated tool is the Anchored Volume-Weighted Average Price (Anchored VWAP), which refines the standard VWAP by allowing traders to set

META Share Price Collapses after Publication of Quarterly Report
Just yesterday, META's stock price closed at USD 493.50, up approximately 40% since the start of 2024 and up nearly 300% since the start of 2023.
However, following the release of Meta's quarterly report, its shares plummeted to USD

USD/JPY Analysis: The Rate Exceeds The Level of 155 Yen Per US Dollar
Today, the price of USD/JPY once again renewed its 34-year high, exceeding the level of 155 yen per dollar, which put pressure on the current authorities.
According to Reuters, officials are trying to maintain calm in the market.
"We