


FXOpen
BTC/USD
From yesterday’s open at $7581 the price of Bitcoin has increased by 5.76% as it came up to $8017 at its highest point today. Last Friday the price came up to $8140 which was the first significant horizontal resistance level on the way up which is why the price got rejected at those levels and was sent back to the levels from which the increase was made. As today we have seen the price coming slightly lower than on Friday it has gotten close to the significant resistance point again and is currently forming a cluster as indicated by the price action.
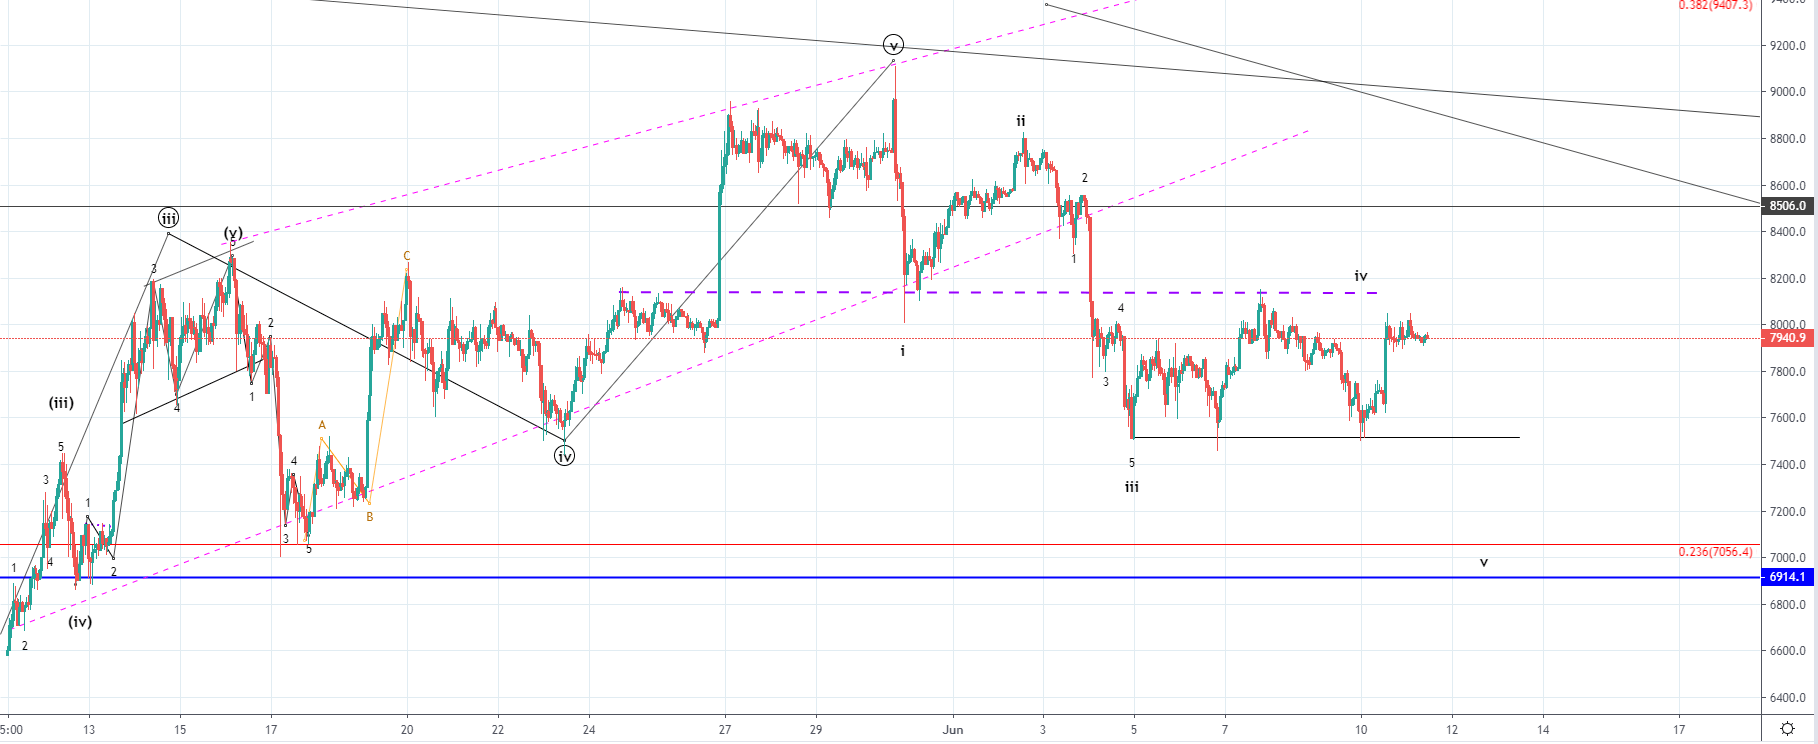 Looking at the hourly chart, you can see that the price hasn’t come up above the purple interrupted line which is the mentioned first significant resistance point above which it is considered to be the start of the 2nd wave’s territory out of the presumed five-wave move from Thursday 30th of May. If we are seeing the starting downtrend with the first five-wave move developing to the downside, the price cannot enter the territory of the 2nd wave on the 4th and as the level was respected the likelihood of the starting downtrend in a five-wave manner is highly likely.
If we are seeing the development of the five-wave move to the downside the price cannot go above $8140 before going down for a lower low below $7513 which is the ending point of the presumed 3rd wave, potentially ending around the 0.236 Fibonacci level at $7056. But if the price continues moving to the upside from here and goes above $8140 we could have seen the three-wave structure ending last Friday with now the second correctional structure to the upside developing in which case the next significant resistance point would be at around $8500.
XRP/USD
From yesterday’s open at $0.37978 the price of Ripple has increased by 6.29% measured to the highest point the price has been today which is at $0.4036.
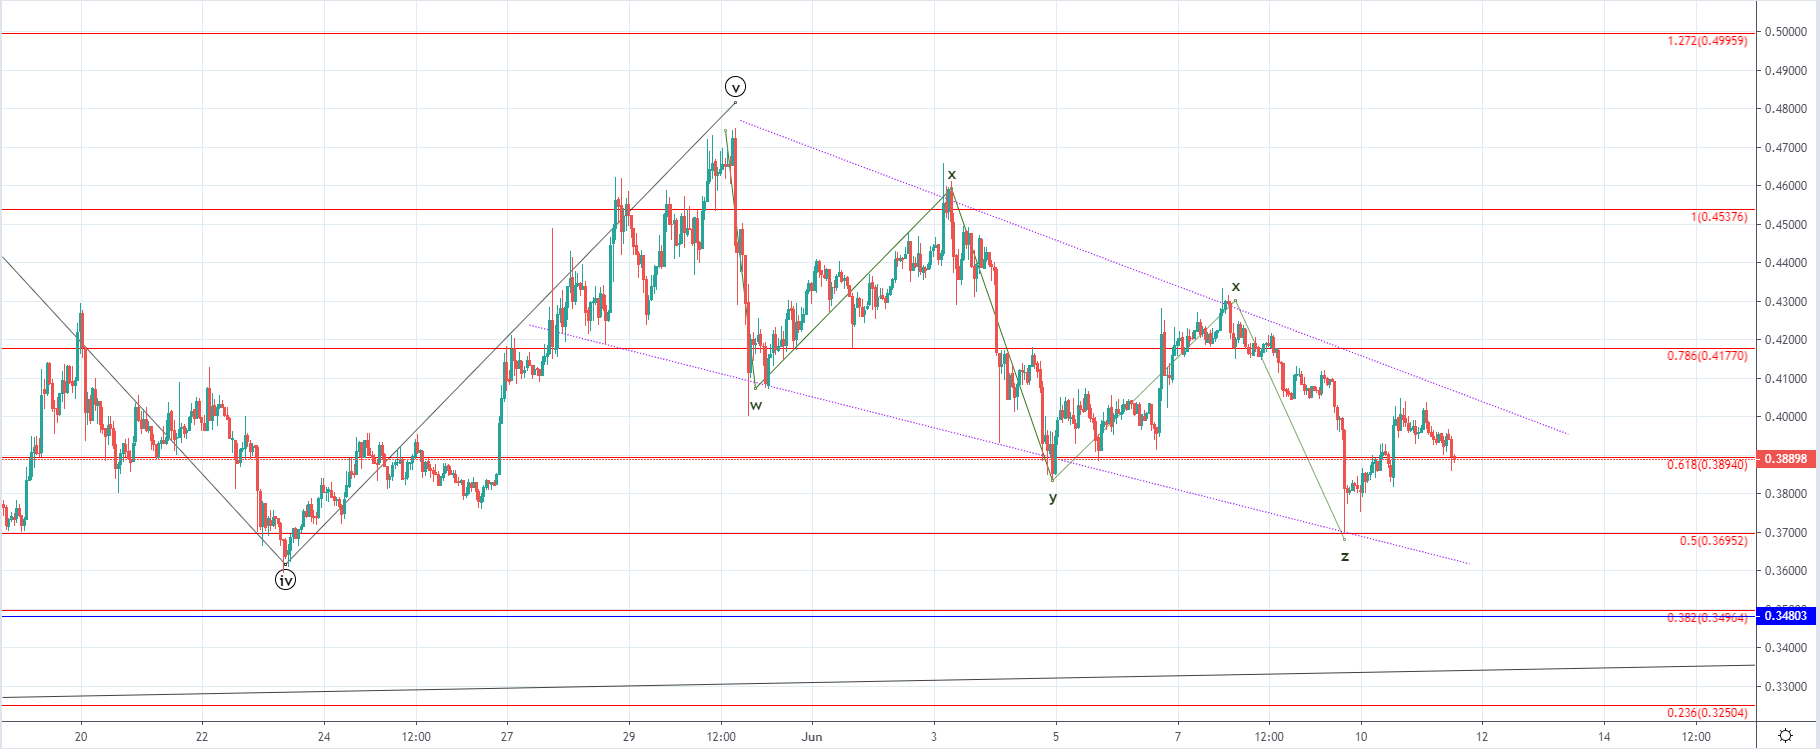
Looking at the hourly chart, you can see that the price has started moving to the downside again and is currently being traded at $0.38940 at the 0.618 Fibonacci level which serves as a support and is currently being tested. The price action formed a descending channel/triangle from 30th of May as it moved in a five-wave manner. As the price came up above 0.786 Fibonacci level last week and entered the territory of the 2nd wave the impulsive wave has been invalidated which is why I believe that more likely we are seeing a WXYXZ correctional structure.
The correction might have ended on the spike to the channel’s support made on Sunday but I believe that a proper interaction with the 0.5 Fibonacci level would mark its end which is why from here I would be expecting another downside move to $0.36952 before its completion. As the price of Ripple ended its five-wave increase on 30th of May we are likely seeing a higher degree correction developing out of which the seen WXYXZ correction would be its first move.
After the completion of the current correction, a breakout from the descending channel on the upside would be expected but if we are seeing the starting downtrend it wouldn’t exceed the 0.786 Fibonacci level before another downturn starts.
FXOpen offers the world's most popular cryptocurrency CFDs*, including Bitcoin and Ethereum. Floating spreads, 1:2 leverage — at your service. Open your trading account now or learn more about crypto CFD trading with FXOpen.
*At FXOpen UK and FXOpen AU, Cryptocurrency CFDs are only available for trading by those clients categorised as Professional clients under FCA Rules and Professional clients under ASIC Rules respectively. They are not available for trading by Retail clients.
This article represents the opinion of the Companies operating under the FXOpen brand only. It is not to be construed as an offer, solicitation, or recommendation with respect to products and services provided by the Companies operating under the FXOpen brand, nor is it to be considered financial advice.
Latest from Cryptocurrencies
Latest articles

Since the Start of the Week, Brent Oil Price Has Dropped over 4%
At the beginning of the week, March 15, we wrote that the price of Brent oil could form a correction from the resistance level of USD 91 per barrel. Since then, the price has decreased by more than 4% due

Fair Value Gaps vs Liquidity Voids in Trading
Understanding fair value gaps and liquidity voids is essential for traders seeking to navigate the complexities of the financial markets. These concepts, deeply rooted in the Smart Money Concept (SMC), provide valuable insights into the dynamics of supply and demand,

UK100 Share Index Rises as UK Inflation Slows
Yesterday, the UK Office for National Statistics (ONS) reported that the CPI stood at 3.2% in March. According to ForexFactory, analysts expected 3.1%, and a month ago the index was 3.4%.
Grant Fitzner, chief economist at the