


FXOpen
BTC/USD
At the moment of our last week’s analysis on Tuesday, December 11th the price of Bitcoin was $3524.5. As the price was in a downward trajectory it kept falling after a small increase and has broken some minor support trendlines in the process line, the minor uptrend line from the December 7th low and the horizontal support level from that low as well and came down to the next significant horizontal level at $3237, which served as support. This whole down move dating from 9th of December when the price of Bitcoin came up to $3713 at its peak is the corrective wave X, which meant that another increase was to be expected to around the same levels or a bit lower than the hight of the W wave ending point.
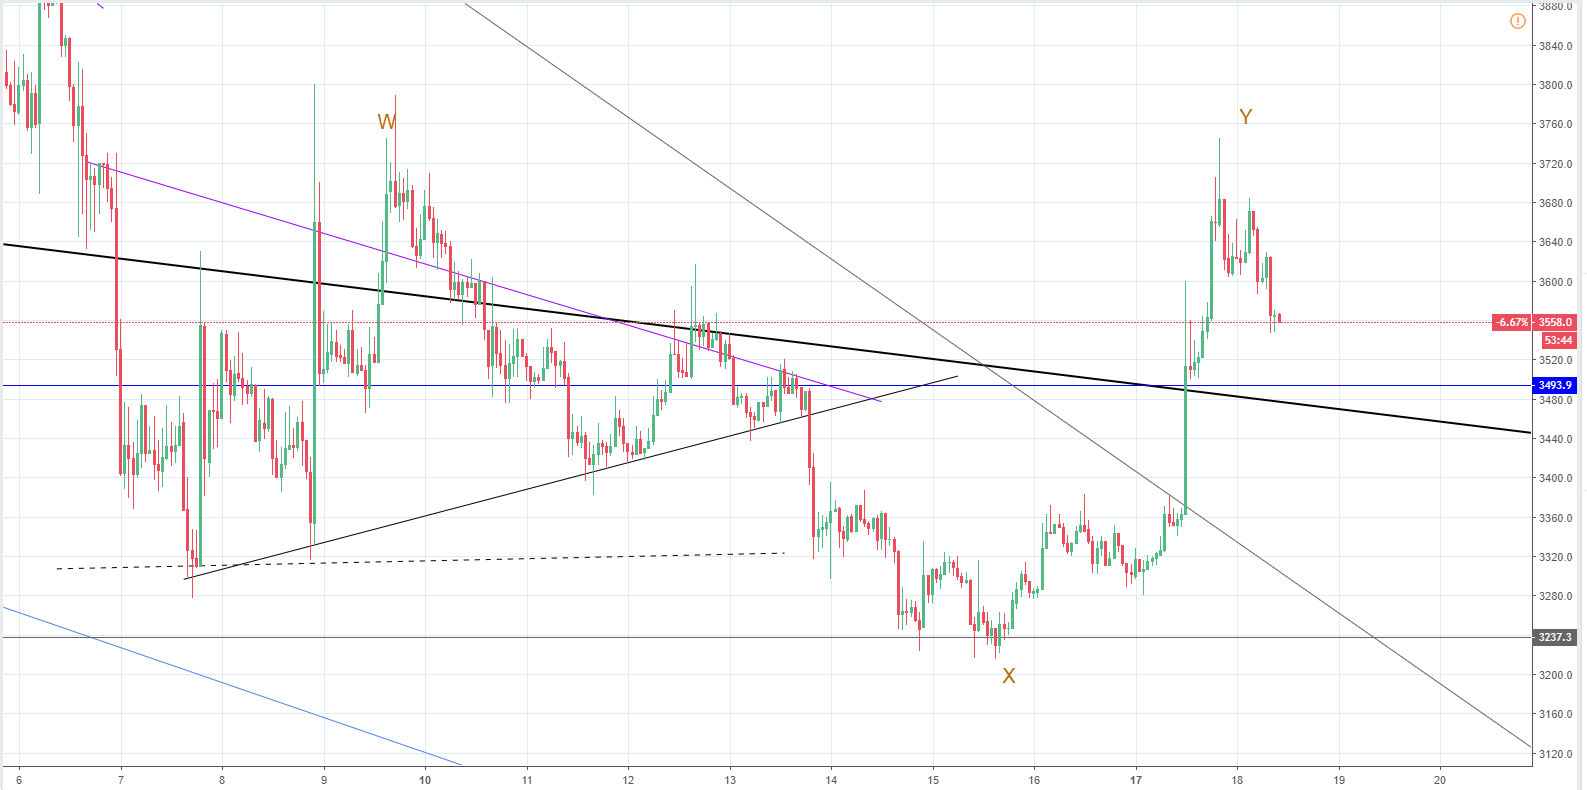
This is exactly what happened as the price of Bitcoin increased by 14% from the horizontal support level at $3237 to $3683, which is close to the vicinity of the W wave ending point. Now, when the price has reached those levels and the Y wave is most likely over, we are seeing a correction and judging by the wick from above the price has encountered the sellers’ territory. This pushes the price back, most likely to the black bold line, which is the baseline support 2 of the downtrend, where it is going to retest the support as the price previously broke it from above.
As the Y wave ended on the uppers side, more downside is to be expected potentially making new yearly lows for the price of Bitcoin.
XRP/USD
Since December 11th when the price of Ripple was at $0.307 the cryptocurrency has fallen by around 7% at first as it came down to $0.2866. This was slightly lower than the previous low, which was at $0.29323 on 7th of December, but as you can see when the price fell below it, an increase has started. It led the price of Ripple to increase to $0.35382, which is the horizontal resistance level. This was an increase of 23.43% in one go. That is why the price has started correcting and is now in a downward trajectory.
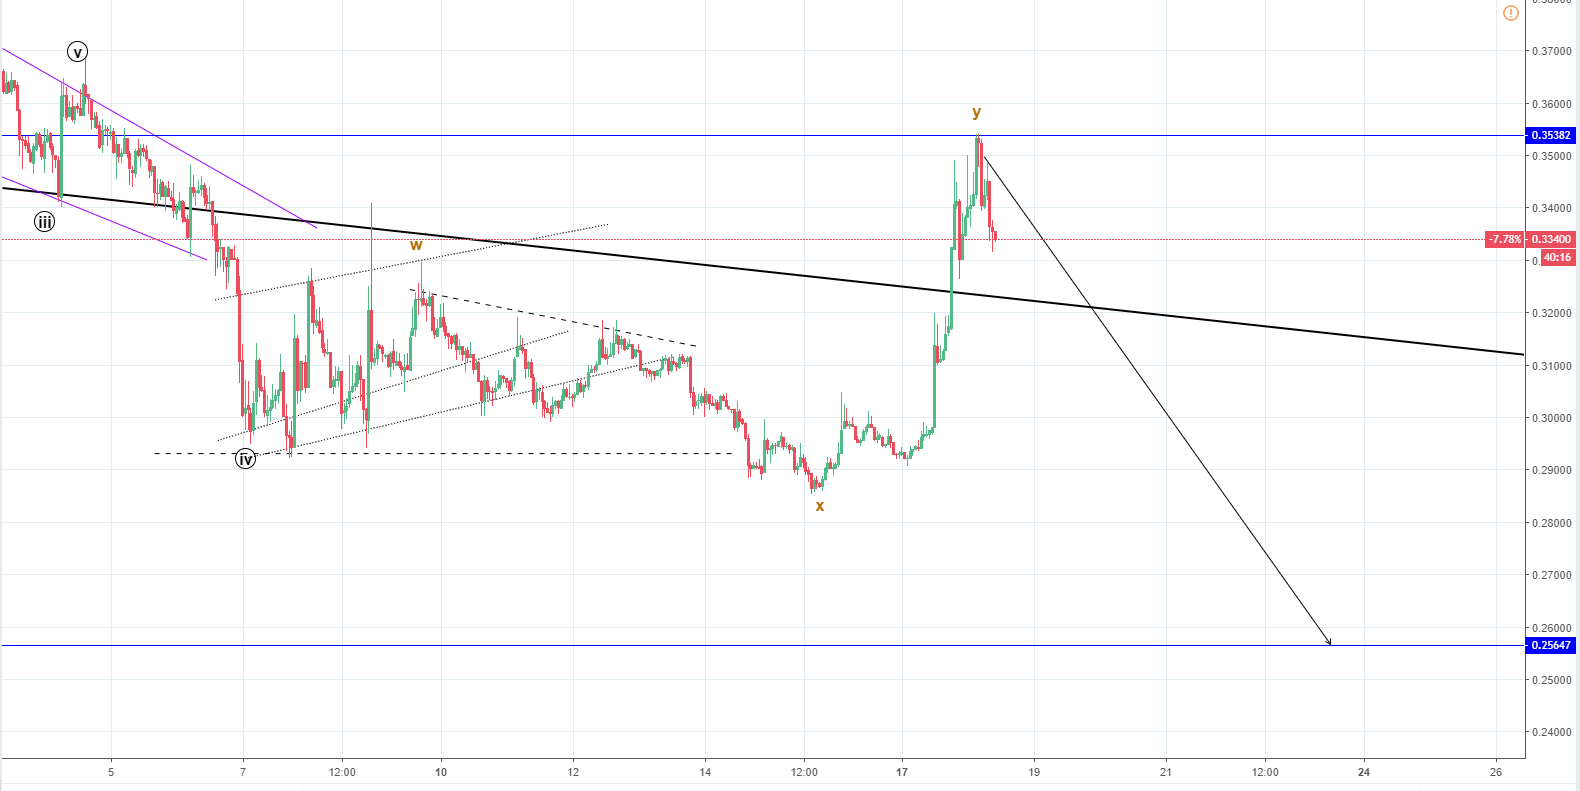
Looking at the hourly chart, you can see that the price action has created a similar pattern like on the Bitcoin’s chart, indicating strong market correlation. The sideways move has been labeled as a WXY correction like in the case of Bitcoin, so now in the upcoming period more downside is to be expected for the price of Ripple that could result in a lower low on the hourly chart and a retest of the yearly low, which is at the horizontal support at $0.2564
At first, I would be looking at what the price does around the bold black line, which is the major support/resistance line and as the price previously broke it. A retest of support is needed before the price could go up.
Both my projected scenarios are implying that the support isn’t going to be there around the bold black lines and that this increase was a corrective one before new lowes or retest of the old lows, but that might not be the case.
If the price find support there, more upside could be expected as the Y wave’s might now have ended.
FXOpen offers the world's most popular cryptocurrency CFDs*, including Bitcoin and Ethereum. Floating spreads, 1:2 leverage — at your service. Open your trading account now or learn more about crypto CFD trading with FXOpen.
*At FXOpen UK and FXOpen AU, Cryptocurrency CFDs are only available for trading by those clients categorised as Professional clients under FCA Rules and Professional clients under ASIC Rules respectively. They are not available for trading by Retail clients.
This article represents the opinion of the Companies operating under the FXOpen brand only. It is not to be construed as an offer, solicitation, or recommendation with respect to products and services provided by the Companies operating under the FXOpen brand, nor is it to be considered financial advice.
Latest articles

Anchored VWAP and How You Can Use It in Forex Trading
In the world of forex trading, understanding the nuanced tools at your disposal can significantly enhance decision-making processes. One such sophisticated tool is the Anchored Volume-Weighted Average Price (Anchored VWAP), which refines the standard VWAP by allowing traders to set

META Share Price Collapses after Publication of Quarterly Report
Just yesterday, META's stock price closed at USD 493.50, up approximately 40% since the start of 2024 and up nearly 300% since the start of 2023.
However, following the release of Meta's quarterly report, its shares plummeted to USD

USD/JPY Analysis: The Rate Exceeds The Level of 155 Yen Per US Dollar
Today, the price of USD/JPY once again renewed its 34-year high, exceeding the level of 155 yen per dollar, which put pressure on the current authorities.
According to Reuters, officials are trying to maintain calm in the market.
"We