


FXOpen
BTC/USD
Since our last week’s analysis on Tuesday, November 27, when the price of Bitcoin was at its lowest point at $3759, it has even spiked to $3683, but the hourly candle has closed above leaving a wick.
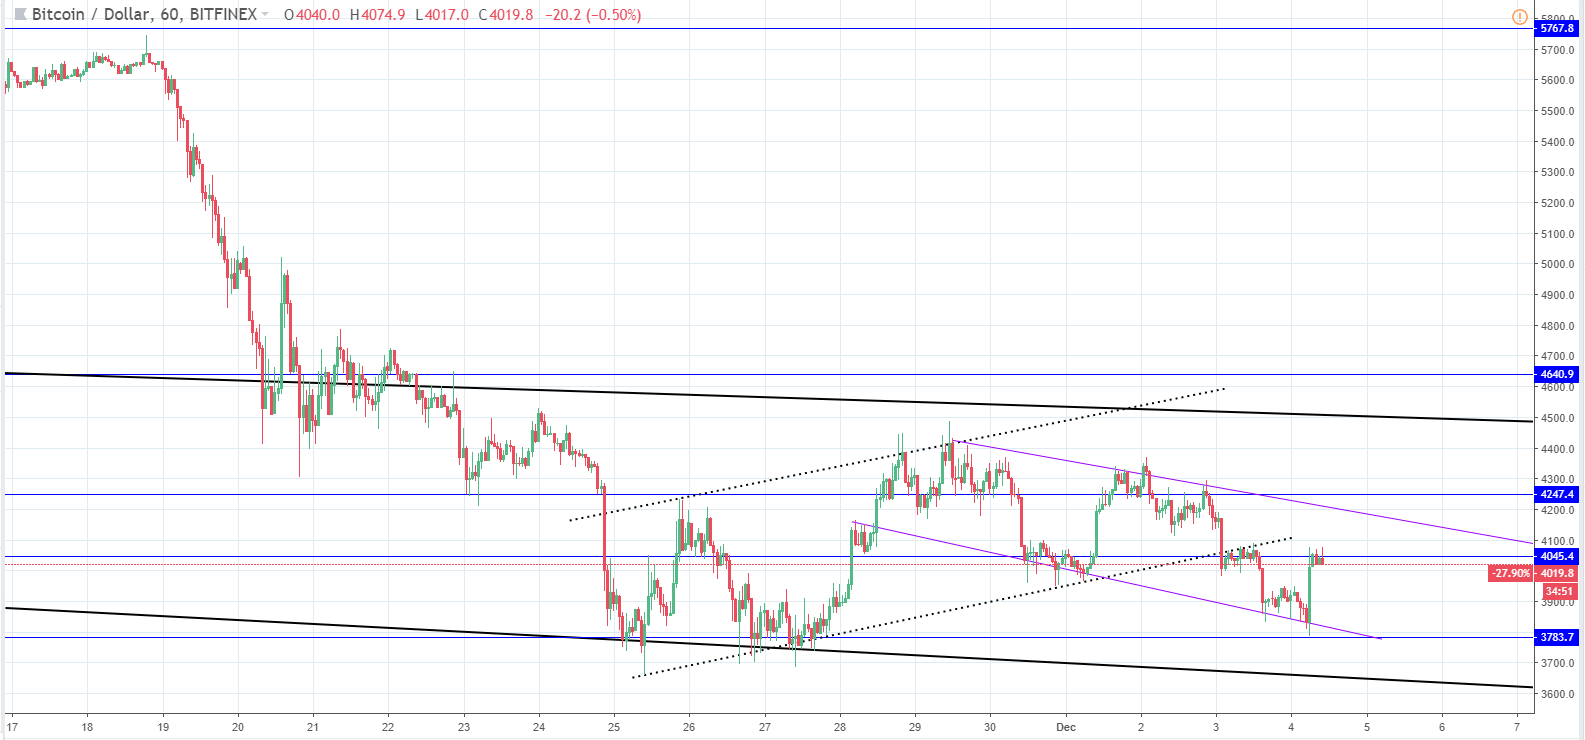
Since that low, which was the lowest price, has been since the start of the year, we saw an increase up to $4416, which was a higher high compared to the previous one at $4169. From there on the price started decreasing and since it came down to the horizontal support level at $4045, price action created a higher low, indicating the start of an uptrend and an ascending channel outline started forming.
As you can see from the hourly chart, I labeled the ascending channels as an unconfirmed one and was waiting for another higher high to confirm it, but the price failed to exceed the prior high making a lower high at $4331. From there another lower low was created as the price fell below the mentioned horizontal support level once again. Another channel has now been established but this one is a descending.
The price is currently at the mentioned horizontal support level again, which now serves as resistance and judging by the candles we are seeing a rejection once again. If the price falls to exceed the horizontal support level and continues its downward trajectory, the next level, which will serve as support, will be at the next horizontal support level or prior low level at $3783 and then potentially further down.
If the price breaks from the current descending channel on the downside, there will be two more significant support levels: the first one being the downtrends support baseline (bold black line) and the next is on the horizontal support level at around $3500.
If the price catches some momentum and continues its upward trajectory, I would expect an interaction with the channels resistance line, after which the horizontal resistance is at $4247.
XRP/USD
Since last Tuesday, when the price of Ripple was at $0.3636 on the open, the cryptocurrency depreciated in value as the price fell to $0.35161 at first. Much like in the case of Bitcoin, the price of Ripple started increasing from there and reached $0.4029 breaking the downtrends resistance line, which was a bullish sign at that moment.
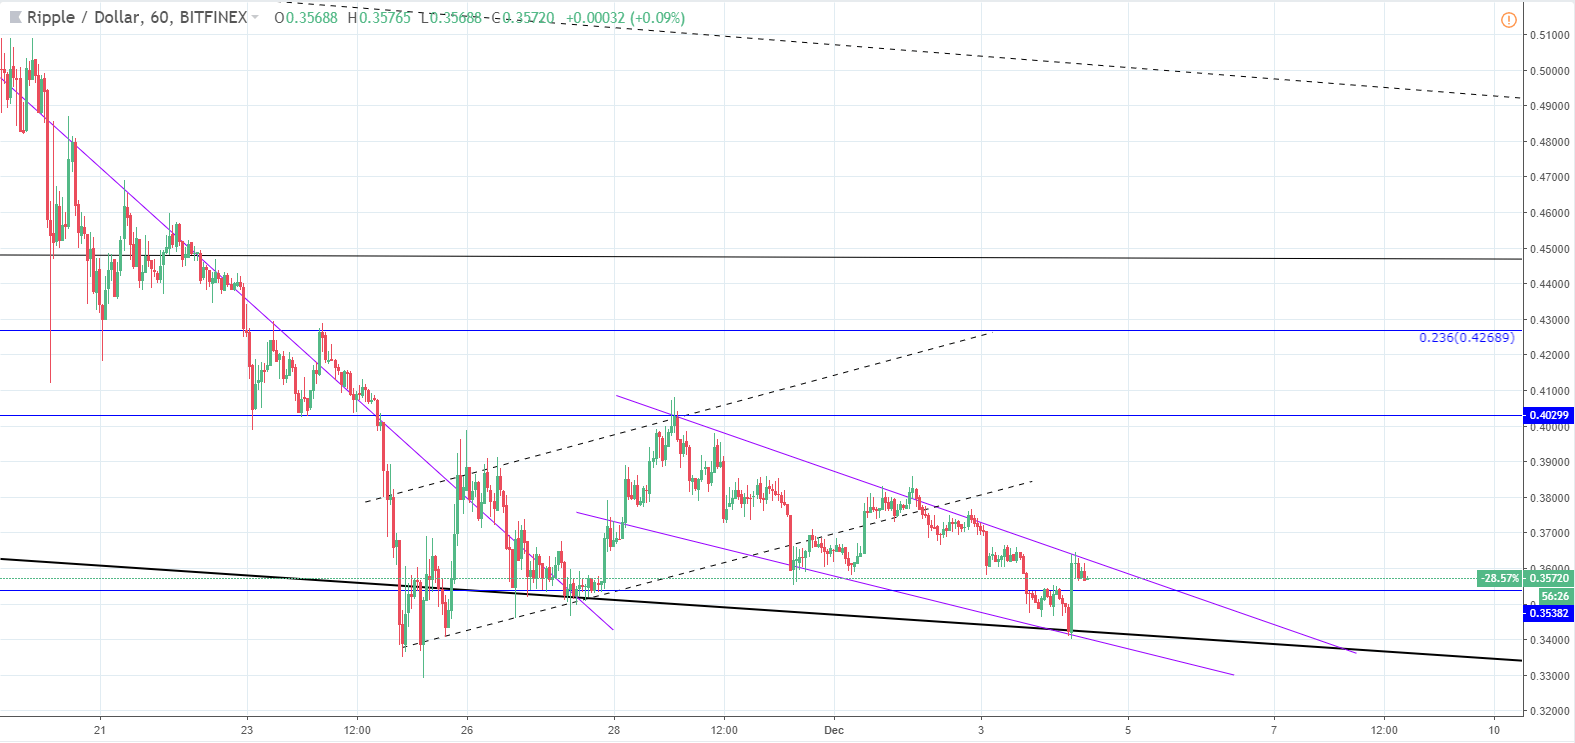
The price started decreasing then and fell down to $0.36 level again, invalidating in that way the unconfirmed ascending channel that started forming. As you can see from the hourly chart since the higher high, the price has created a descending channel since it came down to the second interaction with a bold black line, which is the baseline support from the current range, and is currently interacting with its resistance level.
By looking at the current candles we can see that the price is getting rejected with a clear indication that it will decrease further from. If the price goes further down like expected, we are likely going to see a breakout from the descending channel in which case the price will go down to its first significant support levels at around $0.305.
But if the price starts increasing from here, I wouldn’t expect it to go more than the mentioned horizontal resistance level at $0.4029 at one go.
FXOpen offers the world's most popular cryptocurrency CFDs*, including Bitcoin and Ethereum. Floating spreads, 1:2 leverage — at your service. Open your trading account now or learn more about crypto CFD trading with FXOpen.
*At FXOpen UK and FXOpen AU, Cryptocurrency CFDs are only available for trading by those clients categorised as Professional clients under FCA Rules and Professional clients under ASIC Rules respectively. They are not available for trading by Retail clients.
This article represents the opinion of the Companies operating under the FXOpen brand only. It is not to be construed as an offer, solicitation, or recommendation with respect to products and services provided by the Companies operating under the FXOpen brand, nor is it to be considered financial advice.
Latest from Cryptocurrencies
Latest articles

Weekly Market Wrap With Gary Thomson: UK100, USD, GOLD, OIL
Get the latest scoop on the week's hottest headlines, all in one convenient video. Join Gary Thomson, the COO of FXOpen UK, as he breaks down the most significant news reports and shares his expert insights.
- UK100 Share Index Rises

What Is a Darvas Box Theory and How Does It Work in Trading?
The Darvas Box Theory, pioneered by Nicolas Darvas in the 1950s, has transcended its stock market origins to become a valuable tool for forex traders. This method leverages specific price movements and patterns, known as the Darvas Box, to track

NFLX Stock Price Falls Despite Subscriber Growth
Yesterday, after the close of the main trading session on the stock market, Netflix reported to investors for the 1st quarter of 2024.
The report turned out better than expected:
→ earnings per share: actual = USD 5.28, forecast = USD 4.