


FXOpen
BTC/USD
From last week’s analysis on Tuesday, February 5th when the price of Bitcoin was $3501 the price has decreased at first as the resistance there was too strong for it to break out. Then the price has fallen to $3437 where it was hovering around in a minor horizontal range until Friday, when BTC started increasing exponentially and went from $3440 to $3800 at it’s highest spike. It was an increase of 10.5%.
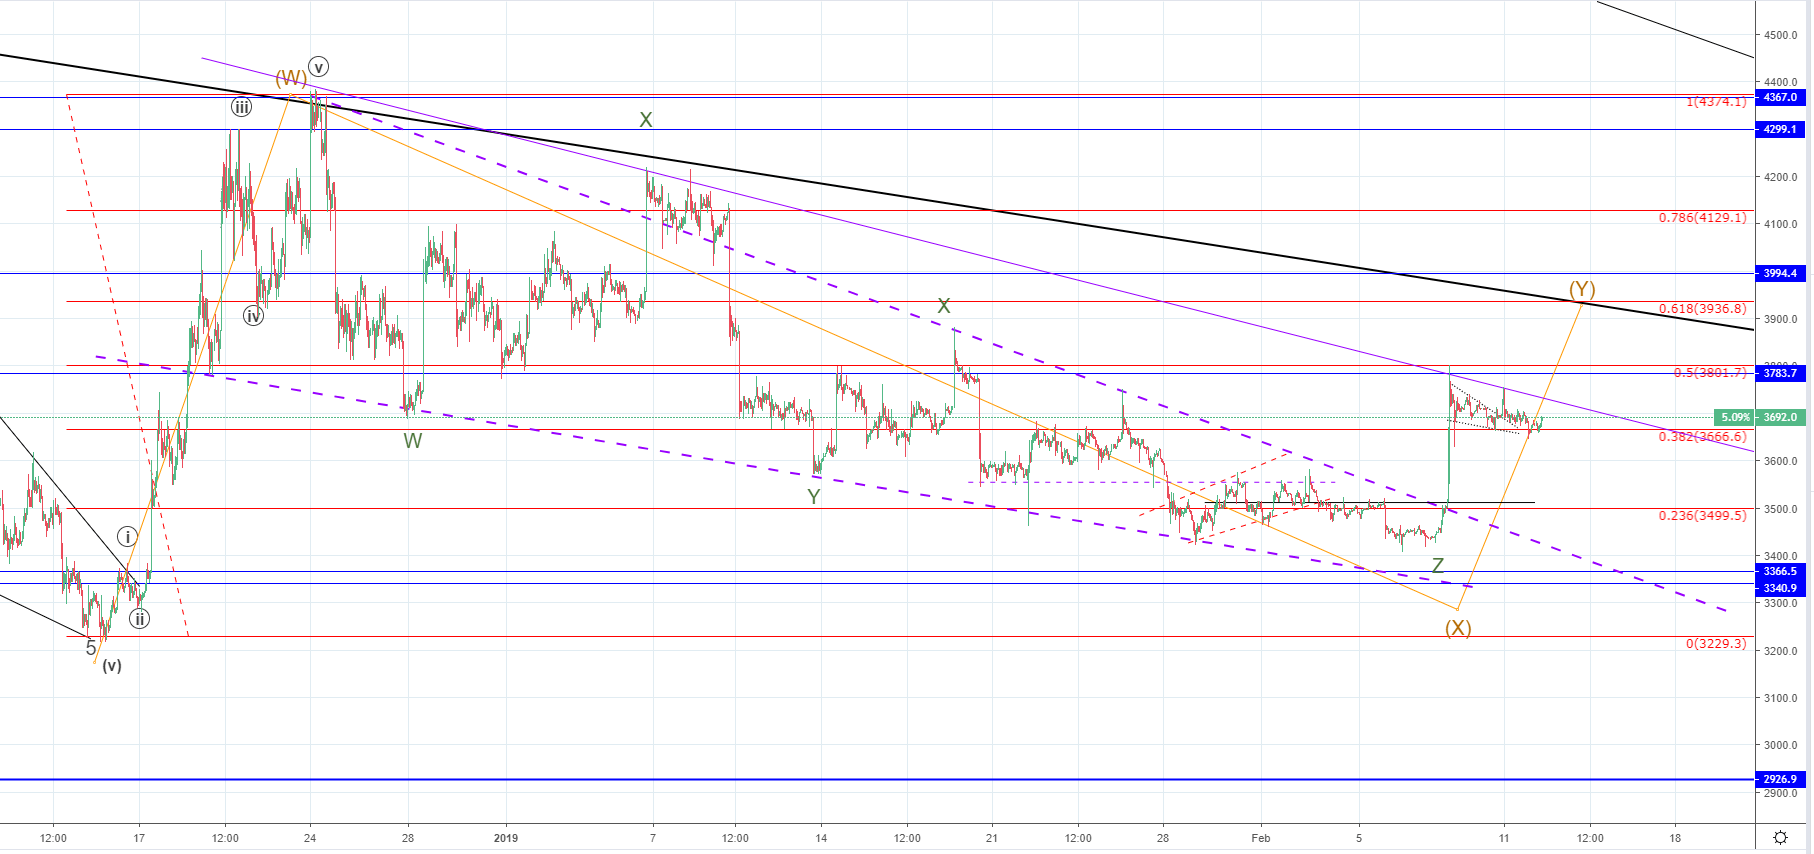
As the price came up to the mentioned levels and interacted with the 0.5 Fibonacci level, we saw a retracement to the 0.328 Fibonacci level on which the price has retested it for support. The price is currently in an upward trajectory. But since there is a strong resistance point above it even if the price action has created a Bull flag, we might not see a breakout just yet, as the price needs to establish firm support first.
The current horizontal support level is not that significant as the next one, so the horizontal resistance at $3783 will be a point of struggle. That is why strong momentum is needed for a breakout. And considering that the momentum has been all used up on Friday we are now likely going to see further retracement, potentially all the way back to $3553 where the previous minor horizontal level is before a continuation and a breakout to the upside.
XRP/USD
From last Tuesday when the price of Ripple was around $0.3 we have seen an increase of 1.48% measured to the current level of $0.30674. The price increased further on Friday and went to $0.325 but since it encountered some strong resistance at those level an immediate retracement took place.
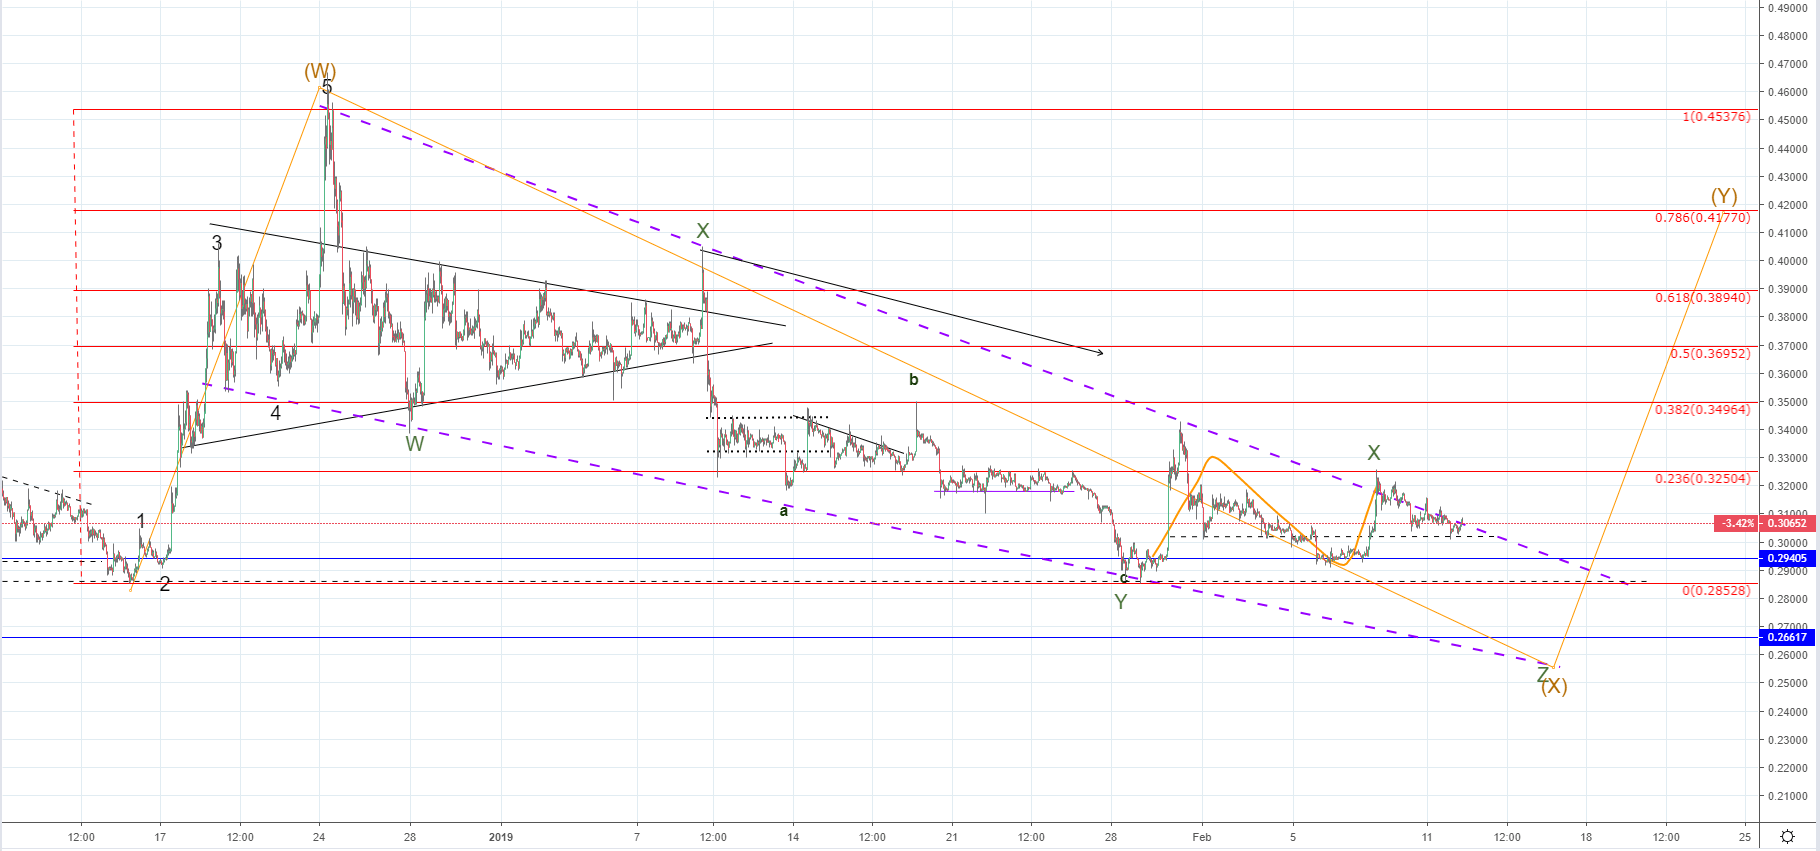
Looking at the hourly chart, you can see that the price is in the corrective stage of the Minor correction inside the falling wedge. The Friday’s increase was to its resistance line and has been interacting with it ever since. The retracement is expected to continue for a bit more as the price has gone down to the horizontal support level at $0.3021. So the support found there might lead to a breakout and that is if the Minor Z wave ended.
On the chart above the correction is labeled as not finished to layout the possibility. But I did end on the now labeled Y wave, and that is why I think the increase we have seen on Friday is the beginning of a breakout. If this is not the case then the price is headed below the mentioned horizontal support level from which we can see the validity of the projected scenario.
FXOpen offers the world's most popular cryptocurrency CFDs*, including Bitcoin and Ethereum. Floating spreads, 1:2 leverage — at your service. Open your trading account now or learn more about crypto CFD trading with FXOpen.
*At FXOpen UK and FXOpen AU, Cryptocurrency CFDs are only available for trading by those clients categorised as Professional clients under FCA Rules and Professional clients under ASIC Rules respectively. They are not available for trading by Retail clients.
This article represents the opinion of the Companies operating under the FXOpen brand only. It is not to be construed as an offer, solicitation, or recommendation with respect to products and services provided by the Companies operating under the FXOpen brand, nor is it to be considered financial advice.
Latest articles

EUR/USD Dives While USD/CHF Extends Rally
EUR/USD started a fresh decline below the 1.0695 support. USD/CHF is rising and might aim a move toward the 0.9250 resistance.
Important Takeaways for EUR/USD and USD/CHF Analysis Today
· The Euro struggled to clear

The Dollar Is Losing Some of Its Gains While Awaiting a Verdict from the Fed
The American currency continues to trade in different directions relative to leading currencies. Thus, the yen paired with theUS dollar fell in price to a 34-year low, and in pairs with European and commodity currencies we are seeing a corrective

5 Stocks To Consider For May 2024
Time flies, especially when things are running smoothly, and this year so far has been a period free of dramatic events across the capital markets.
Suddenly, we are almost halfway through 2024, and the forthcoming month takes us up to