


FXOpen
BTC/USD
Last Tuesday when the price of Bitcoin was $3783 at its lowest point we have seen an increase of 4.88% as the price was coming up to $3954 until 6th of March. From there the price action continued moving to the upside but in smaller moves, which made an ascending channel that lead the price to the horizontal resistance level at $3994.4. It was first crossed from the upside but this quick fakeout lead to a steep downfall back to the 0.618 Fibonacci level at the $3936 support.
After the price found support there it started increasing again in a five-wave manner and managed to go once again above the $3994.4 resistance line slightly higher than before as it came to $4043 at its highest spike. But since it entered the sellers’ territory another downtrend started in a three-wave manner as the price came down to the first horizontal support from the previous sideways channel at around $3901 at its lowest point today.
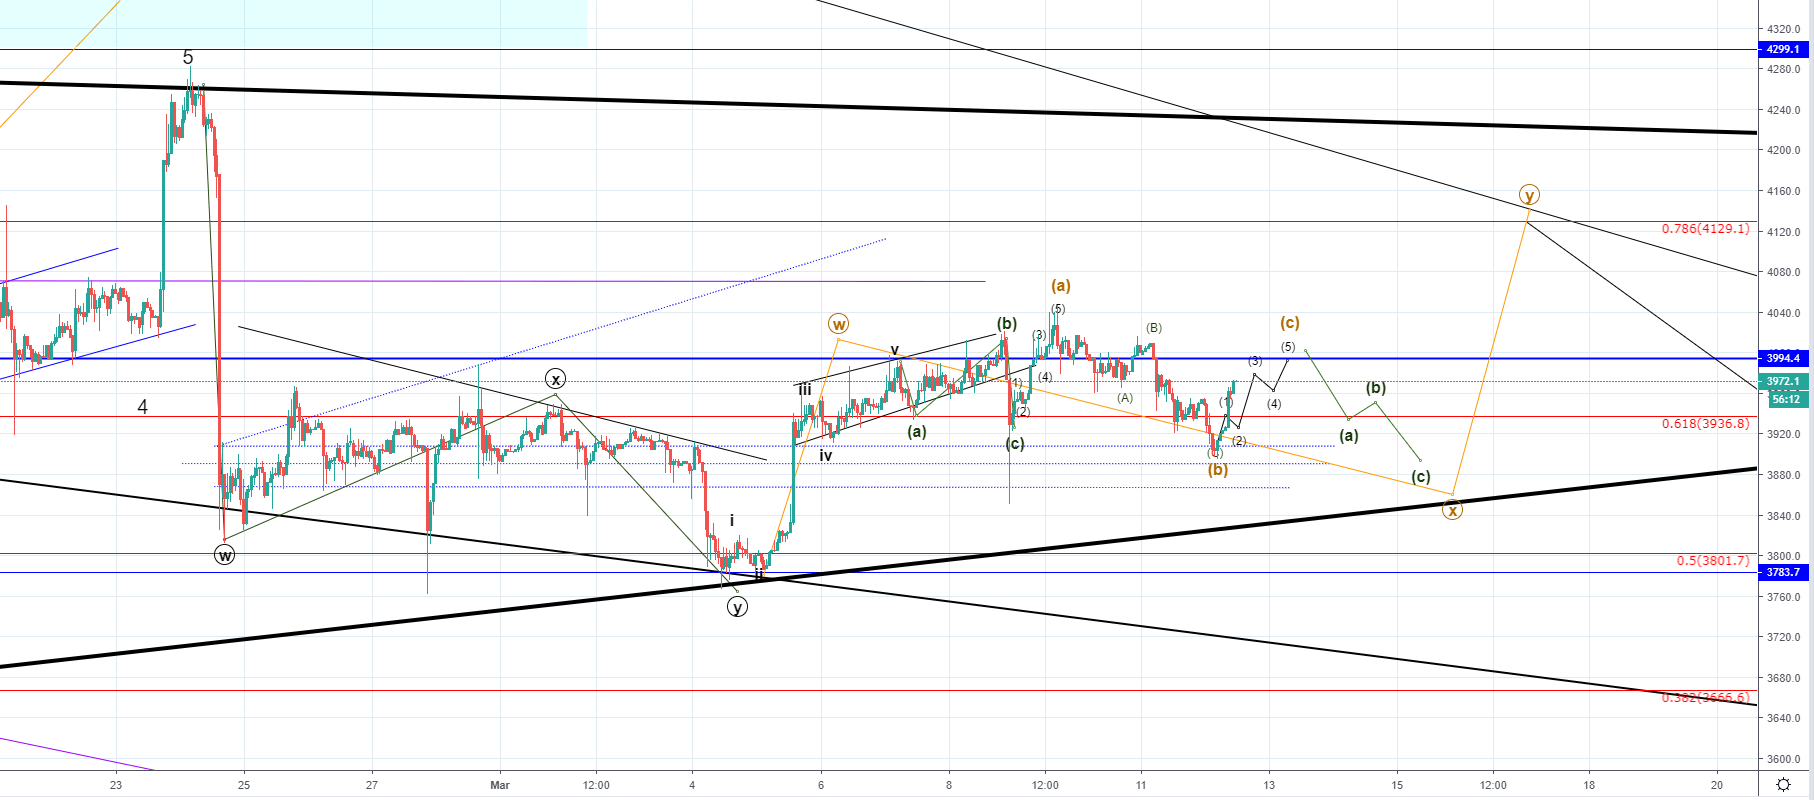
Now that the price is once again in an upward trajectory. We are most likely seeing another five-wave move which will in conjunction with the price action movement from the opening on March 9th constitute a three-wave correction to the upside. This upward movement is set to retest the resistance at $3994.4 or move slightly higher again, although not very likely after which another third correction would take place, marking the end of the Minute wave X, which could be a retest of the ascending support line or the lower support from the previous sideways horizontal range at $3870.
After this happens I would be expecting another increase, which would be the Minute wave Y in a five-wave manner. It would be a continuation of the five-wave move we’ve seen last Tuesday. The increase is set to retest some of the above resistance points out of which the most significant zone would be at the intersection between the 0.786 Fibonacci level and the descending trendline, which is the resistance line from the falling wedge seen on a higher time-frame. The price could continue moving higher and the next resistance point it could encounter is the upper bold black line, which is the resistance from the ascending triangle formed from on 15th of December last year when the Intermediate WXY correction started. This would lead to a price target of $4250-4130.
XRP/USD
From last Tuesday, March 5th, when the price of Ripple was at $0.30714 at its lowest point, we have seen an increase of 6.6% at first as the price was in the upward trajectory and came up to $0.32738 at its highest point.
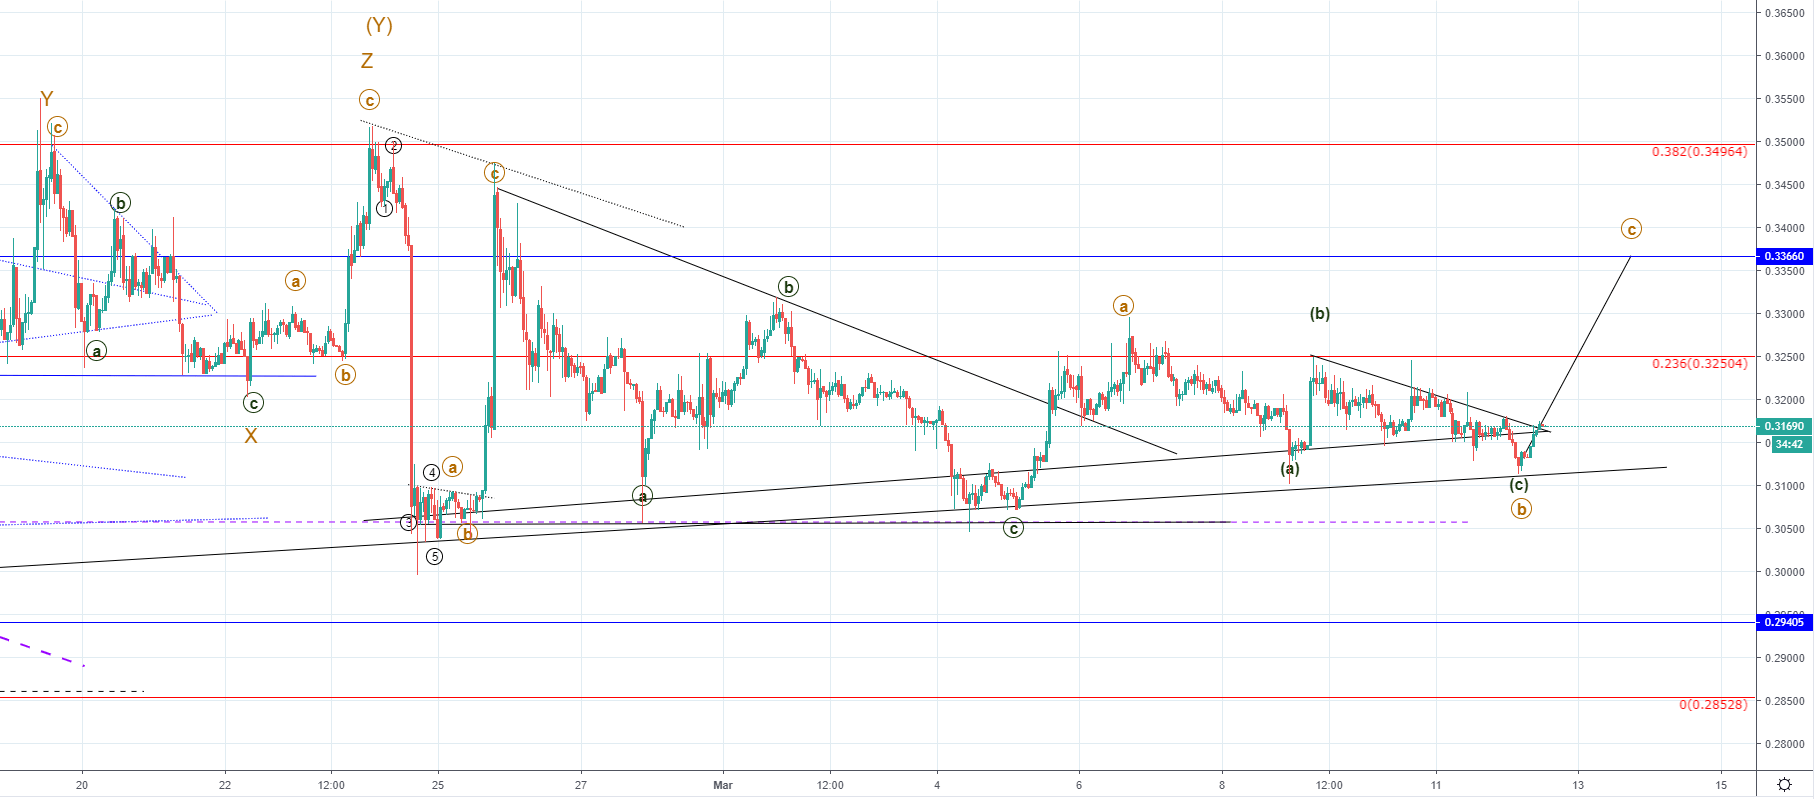
Looking at the hourly chart you can see that the price of Ripple interacted with the 0.236 Fibonacci level last week where it encountered resistance. It set off the price in a downward trajectory again. Another attempt has been made on 9th but the price hasn’t exceeded the prior high making only a short interaction with the Fibonacci level with a wick which again propelled the price in a downward trajectory and came for a lower low at $0.31209 today.
Now that the price started increasing again. We are most likely seeing the development of the C wave to the upside from the ABC correction might now be taking place after the previous to the downside ended. If this is true, we could see the price of Ripple exceeding the Fibonacci level and going to around $0.3366 where the next horizontal resistance point is.
FXOpen offers the world's most popular cryptocurrency CFDs*, including Bitcoin and Ethereum. Floating spreads, 1:2 leverage — at your service. Open your trading account now or learn more about crypto CFD trading with FXOpen.
*At FXOpen UK and FXOpen AU, Cryptocurrency CFDs are only available for trading by those clients categorised as Professional clients under FCA Rules and Professional clients under ASIC Rules respectively. They are not available for trading by Retail clients.
This article represents the opinion of the Companies operating under the FXOpen brand only. It is not to be construed as an offer, solicitation, or recommendation with respect to products and services provided by the Companies operating under the FXOpen brand, nor is it to be considered financial advice.
Latest from Cryptocurrencies
Latest articles

What Is a Darvas Box Theory and How Does It Work in Trading?
The Darvas Box Theory, pioneered by Nicolas Darvas in the 1950s, has transcended its stock market origins to become a valuable tool for forex traders. This method leverages specific price movements and patterns, known as the Darvas Box, to track

NFLX Stock Price Falls Despite Subscriber Growth
Yesterday, after the close of the main trading session on the stock market, Netflix reported to investors for the 1st quarter of 2024.
The report turned out better than expected:
→ earnings per share: actual = USD 5.28, forecast = USD 4.

Escalation Between Iran and Israel: How the Price of Brent Oil Reacts
On the night of Thursday into Friday, reports emerged that Israel had attacked Iran following Iran's attack on Israel over the weekend.
Let's remember that we wrote on Monday that after a 300 drone and missile attack on Israel over