


FXOpen
The Euro (EUR) continued its losing streak against the US Dollar (USD) in December, dragging the price of EURUSD to less than 1.0450 following the announcements of landmark monetary policies from both –the Federal Reserve as well as European Central Bank (ECB) – unveiling completely opposite monetary policy directions. The technical bias remains bearish because of a lower low and lower high in the recent upside rally.
Technical Analysis
As of this writing, the pair is being traded around 1.0436. A support can be seen near 1.0334, the low of January 2003 ahead of 1.0206, a key horizontal support area and then 1.0000, the landmark parity level where we expect a major buying interest. However, a break and daily closing below the parity line shall incite renewed selling interest, validating a move towards the 0.9613 support zone.
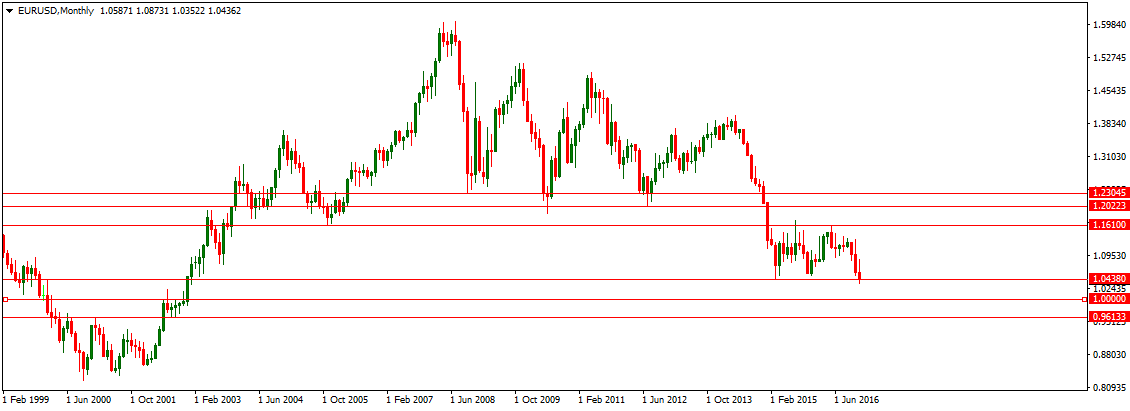
On the upside, the pair is expected to face a hurdle near 1.0438, the horizontal resistance ahead of 1.1610, a confluence of numerous resistance levels and then 1.1876, the low of June 2016 which shall act as critical resistance zone. The technical bias shall remain bearish as long as the 1.1610 resistance area is intact.
Fed/ECB Monetary Policies
Earlier this month, the US Central Bank, Federal Reserve increased its benchmark interest rate for the first time in 2016, signaling at least three more interest rate increases by the end of next year – a highly hawkish stance which was not expected by economists.
On the other hand, the ECB took a 360-degree opposite stance, although they decreased the size of monthly bond purchases but the bank unexpectedly increased the time period for the ongoing quantitative easing program – a highly dovish stance which was not expected by economists. The ECB decision shows that things are still bad for the Eurozone and the central bank is highly concerned about low inflation and fragile economic growth in European countries.
Trade Idea
Considering the overall technical and fundamental outlook, selling the pair on short term rallies appears to be a good strategy for near term trading. 1.1876 (as mentioned before) could be a good selling point if we get a valid bearish reversal candle on the daily chart.
Trade over 50 forex markets 24 hours a day with FXOpen. Take advantage of low commissions, deep liquidity, and spreads from 0.0 pips. Open your FXOpen account now or learn more about trading forex with FXOpen.
This article represents the opinion of the Companies operating under the FXOpen brand only. It is not to be construed as an offer, solicitation, or recommendation with respect to products and services provided by the Companies operating under the FXOpen brand, nor is it to be considered financial advice.
Latest from Forex Analysis
Latest articles

Weekly Market Wrap With Gary Thomson: UK100, USD, GOLD, OIL
Get the latest scoop on the week's hottest headlines, all in one convenient video. Join Gary Thomson, the COO of FXOpen UK, as he breaks down the most significant news reports and shares his expert insights.
- UK100 Share Index Rises

What Is a Darvas Box Theory and How Does It Work in Trading?
The Darvas Box Theory, pioneered by Nicolas Darvas in the 1950s, has transcended its stock market origins to become a valuable tool for forex traders. This method leverages specific price movements and patterns, known as the Darvas Box, to track

NFLX Stock Price Falls Despite Subscriber Growth
Yesterday, after the close of the main trading session on the stock market, Netflix reported to investors for the 1st quarter of 2024.
The report turned out better than expected:
→ earnings per share: actual = USD 5.28, forecast = USD 4.