


FXOpen
Gold price is likely forming a base around $1,260 for an upward move. On the other hand, crude oil price is trading with positive signs, but it is approaching a major resistance near $66.80.
Important Takeaways for Gold and Oil
- Gold price found support near $1,260 after a major decline against the US Dollar.
- There was a break above a key bearish trend line with resistance at $1,266 on the hourly chart of gold.
- Crude oil price broke a major bearish trend line at $66.00.
- On the upside, there is a significant resistance near the $66.80 zone
Gold Price Technical Analysis
Gold price started a major bearish wave from well above the $1,300 handle against the US Dollar. The price declined and broke many supports, including $1,295, $1,280, $1,275 and $1,270.
The price traded close to the $1,260 level and formed a low at $1,261.51. Later, a support base was formed and the price started an upward correction. It traded higher and broke the 23.6% Fib retracement level of the last drop from the $1,283 high to $1,261 low.
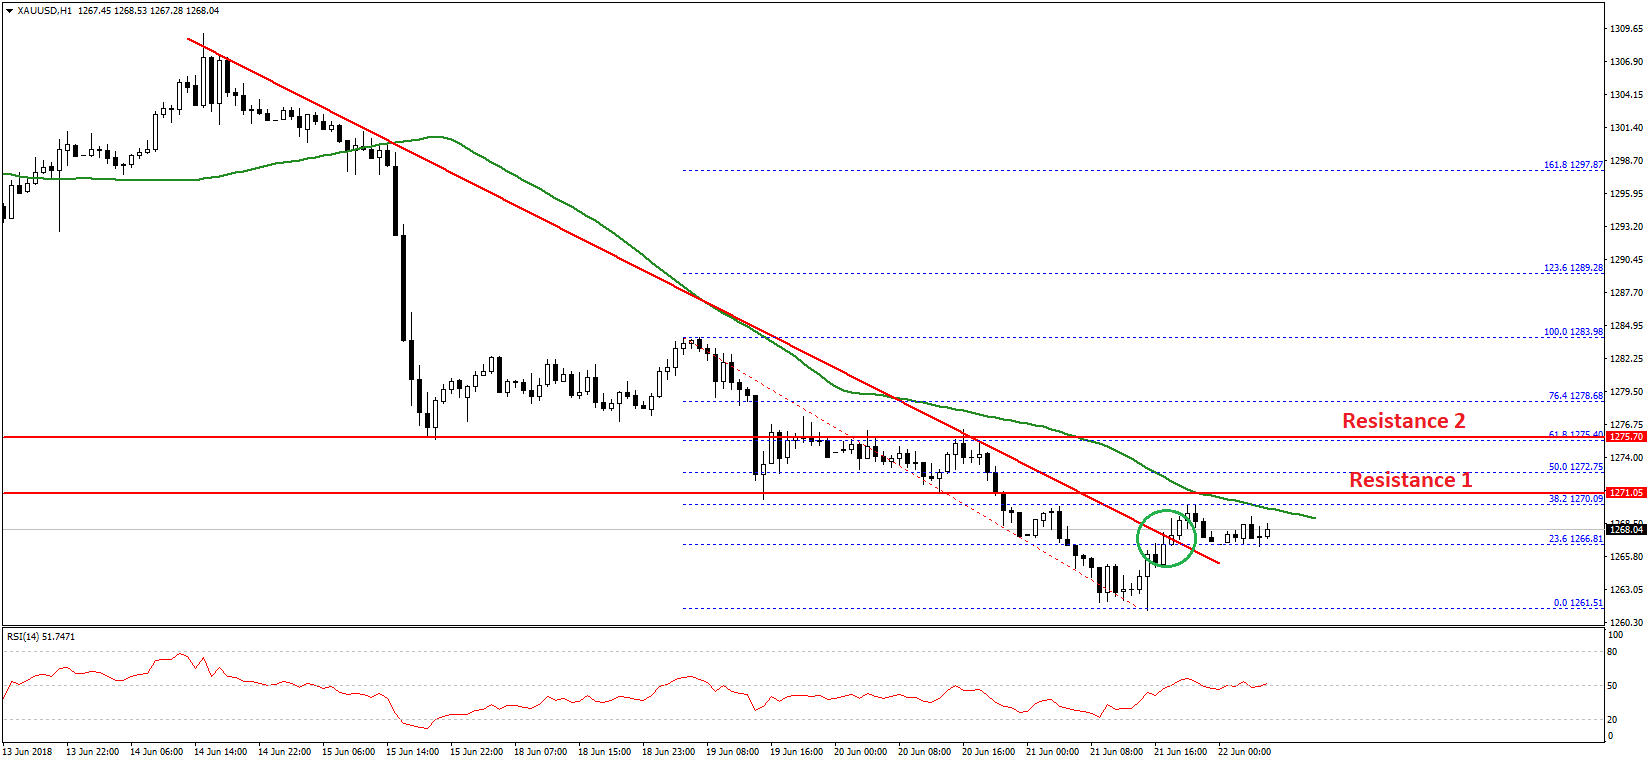
More importantly, there was a break above a key bearish trend line with resistance at $1,266 on the hourly chart of gold. However, the price faced selling interest near the $1,270 level and the 50 hourly simple moving average.
To the topside, there are many resistances around the $1,275 level. The mentioned level was a support earlier, and now it could stop gains towards $1,280. An intermediate resistance is near the 50% Fib retracement level of the last drop from the $1,283 high to $1,261 low at $1,272.
Therefore, it seems like gold price is facing a tough challenge above the $1,272 level. A break and close above $1,275 is required for buyers to gain momentum.
On the downside, the $1,260-1,262 zone is a major support area. As long as the price is above $1,260, it may recover above $1,275.
Oil Price Technical Analysis
After a few bearish moves, crude oil price formed a decent support at $64.00. A fresh upward wave was initiated and the price moved above the $65.00 resistance and the 50 hourly simple moving average.
The upside move was strong as the price succeeded in clearing the 50% Fib retracement level of the last drop from the $66.26 high to $64.20 low. Moreover, there was a break above a major bearish trend line at $66.00.
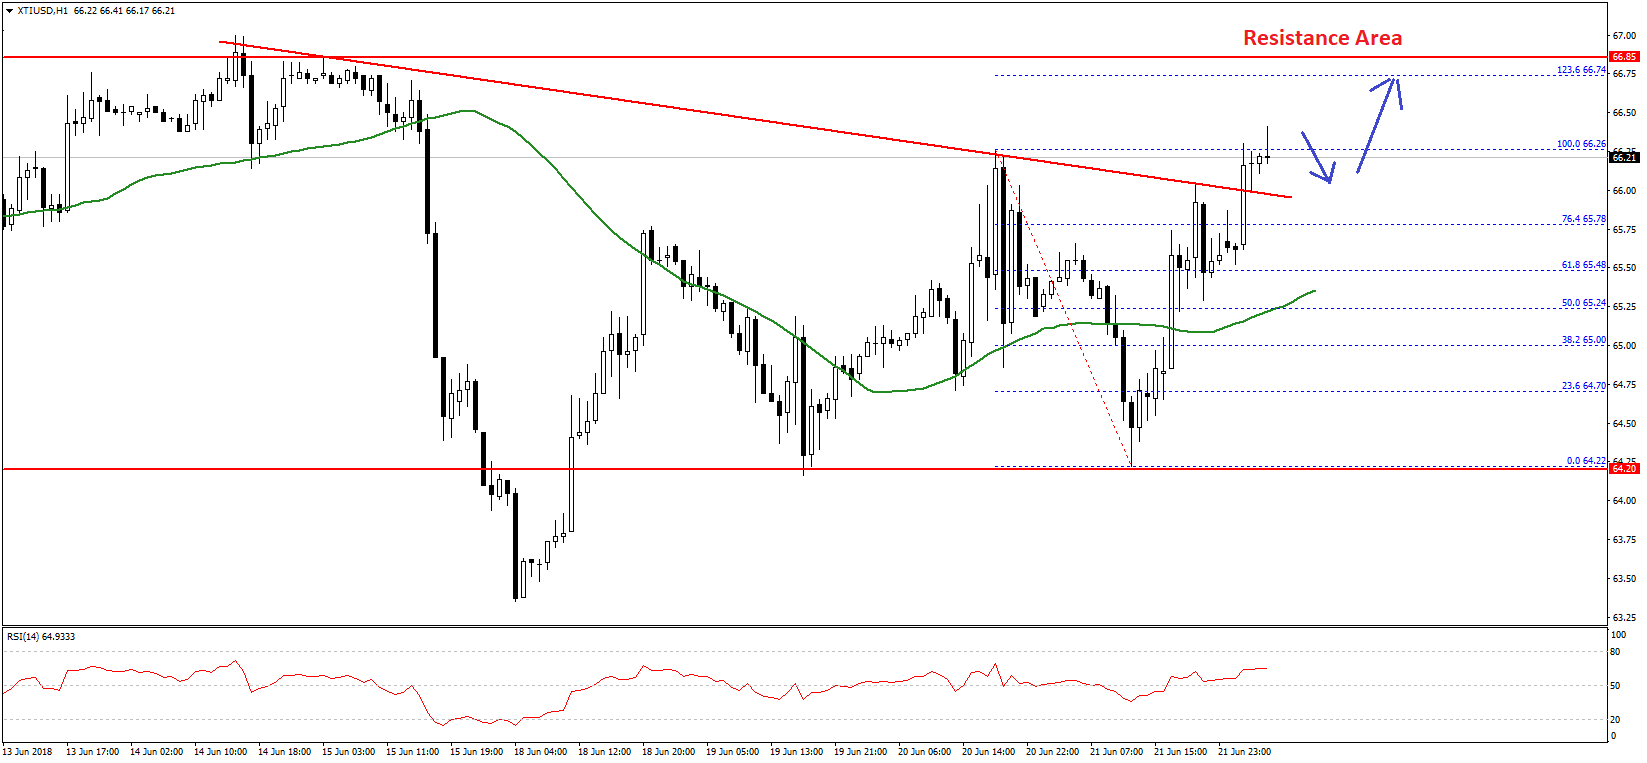
It opened the doors for more gains and the price is currently trading near the last swing high of $66.25. It may correct a few points in the near term, but downsides are likely to remain supported above $65.80.
On the upside, the next target for buyers could be around the 1.236 Fib extension level of the last drop from the $66.26 high to $64.20 low at $66.74. Above this, the $66.75-80 zone is a major resistance zone, and therefore, a break above $66.80 won’t be easy.
Should the price succeeds in clearing $66.80, it could break the $67.00 barrier for a push towards $67.50. On the downside, supports are seen at $66.00, $65.80 and $65.50.
Trade over 50 forex markets 24 hours a day with FXOpen. Take advantage of low commissions, deep liquidity, and spreads from 0.0 pips. Open your FXOpen account now or learn more about trading forex with FXOpen.
This article represents the opinion of the Companies operating under the FXOpen brand only. It is not to be construed as an offer, solicitation, or recommendation with respect to products and services provided by the Companies operating under the FXOpen brand, nor is it to be considered financial advice.
Latest from Forex Analysis
Latest articles

Anchored VWAP and How You Can Use It in Forex Trading
In the world of forex trading, understanding the nuanced tools at your disposal can significantly enhance decision-making processes. One such sophisticated tool is the Anchored Volume-Weighted Average Price (Anchored VWAP), which refines the standard VWAP by allowing traders to set

META Share Price Collapses after Publication of Quarterly Report
Just yesterday, META's stock price closed at USD 493.50, up approximately 40% since the start of 2024 and up nearly 300% since the start of 2023.
However, following the release of Meta's quarterly report, its shares plummeted to USD

USD/JPY Analysis: The Rate Exceeds The Level of 155 Yen Per US Dollar
Today, the price of USD/JPY once again renewed its 34-year high, exceeding the level of 155 yen per dollar, which put pressure on the current authorities.
According to Reuters, officials are trying to maintain calm in the market.
"We