


FXOpen
The crash of bitcoin that started on September 5th abruptly ended the rally. In the span of 16 hours BTC lost almost 15 percent of its value, falling from $7,381 to a low of $6,294 dollars. Most cryptos followed suit, with Litecoin declining by close to 21% during the same time period.
Bitcoin Drops by 15 Percent
As noted above BTC/USD dropped by close to 15 percent in the span of 16 hours. The crash started around midday on September 5th from $7,381 dollars, a low of $6,294 dollars was hit in the morning on September 6th. From here we stabilized a bit but two days later a new low of $6,116 dollars was made. Some pinned the selling on news that Goldman Sachs will not open a crypto trading desk anytime soon. However this seems like too small of a catalyst for such a large market over-reaction. We are currently quoted at $6,298 dollars per coin.
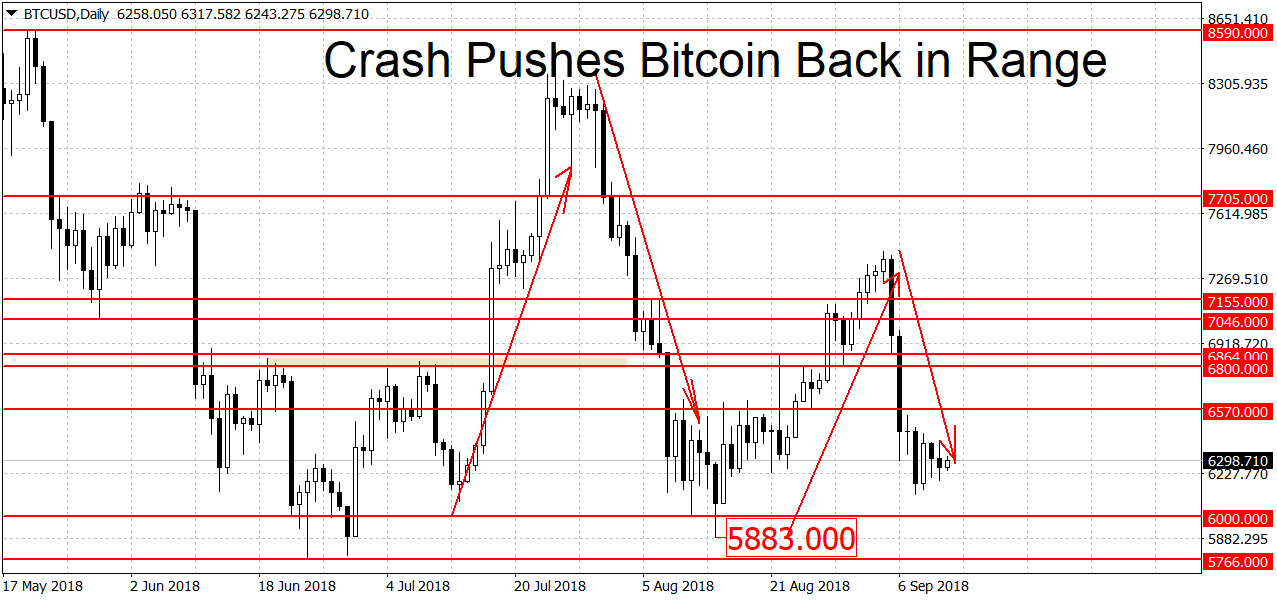
As you can probably deduce from the picture above, no clear trend can be seen on the daily chart. A decisive break below the $6,000 round figure may change this and push us back in a bear market. Conservative traders may wait for a break of $5,700 dollars before jumping in. On the top end the bulls need a break of this month’s high at $7,409 dollars to re-start the rally.
The $5,700 to $6,000 area is a triple-bottom for BTC/USD. We got three bounces here in February, June and August of this year. A clearing of this area could quickly lead to a test of the $5,000 round figure. On the longer-term charts the picture hasn’t changed. Bitcoin is slightly bearish on the weeklies and slightly bullish on the monthlies.
Litecoin Falls by 21 Percent
Like most cryptos Litecoin followed BTC in the crash, initially falling by 21 percent, from $67 to $53 dollars per coin. Unlike bitcoin however the losses in LTC/USD continue, with the pair hitting a low of $49.84 dollars today.
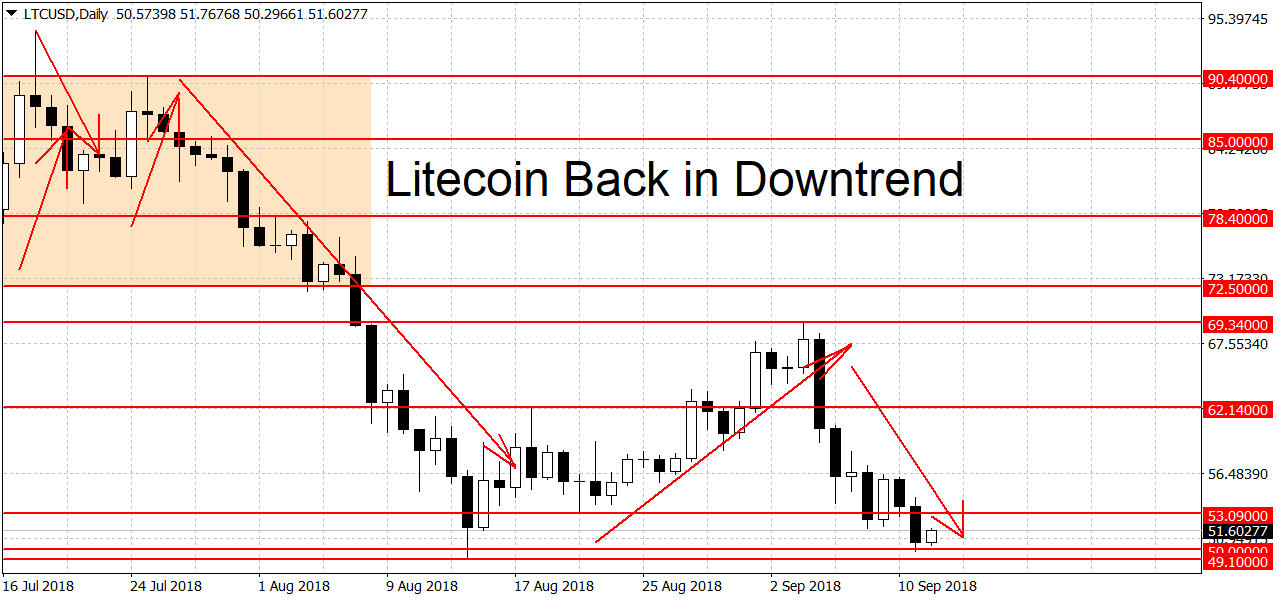
We are currently trading at $51.60 dollars, only $1.76 dollars off the recent low and $2.50 dollars off the 2018 low. The trend on the daily chart is now down. However due to the proximity of the support around $49-50 dollars conservative traders may choose to wait for this area to clear before jumping in.
The bulls need a breakout above the most recent swing high at $69.34 to end the downtrend. On the weekly chart Litecoin is also bearish. The monthlies are still clinging onto a slight bullish bias.
MT4 Bitcoin trading on FXOpen Crypto accounts.
FXOpen offers the world's most popular cryptocurrency CFDs*, including Bitcoin and Ethereum. Floating spreads, 1:2 leverage — at your service. Open your trading account now or learn more about crypto CFD trading with FXOpen.
*At FXOpen UK and FXOpen AU, Cryptocurrency CFDs are only available for trading by those clients categorised as Professional clients under FCA Rules and Professional clients under ASIC Rules respectively. They are not available for trading by Retail clients.
This article represents the opinion of the Companies operating under the FXOpen brand only. It is not to be construed as an offer, solicitation, or recommendation with respect to products and services provided by the Companies operating under the FXOpen brand, nor is it to be considered financial advice.
Latest articles

Anchored VWAP and How You Can Use It in Forex Trading
In the world of forex trading, understanding the nuanced tools at your disposal can significantly enhance decision-making processes. One such sophisticated tool is the Anchored Volume-Weighted Average Price (Anchored VWAP), which refines the standard VWAP by allowing traders to set

META Share Price Collapses after Publication of Quarterly Report
Just yesterday, META's stock price closed at USD 493.50, up approximately 40% since the start of 2024 and up nearly 300% since the start of 2023.
However, following the release of Meta's quarterly report, its shares plummeted to USD

USD/JPY Analysis: The Rate Exceeds The Level of 155 Yen Per US Dollar
Today, the price of USD/JPY once again renewed its 34-year high, exceeding the level of 155 yen per dollar, which put pressure on the current authorities.
According to Reuters, officials are trying to maintain calm in the market.
"We