


FXOpen
Dash prices had a sharp drop since our last update and not only ended the uptrend but entered a bear market on the daily charts. Ether ended its rally as well but didn’t take out any important support levels in the previous two weeks.
Ether Back in Neutral Mode
Ether prices are now in neutral mode on the daily charts. The drop took us to a low of 0.03534 BTC on FXOpen, from as high as 0.05805 on March 25th. The sharp correction is visible on the chart below.
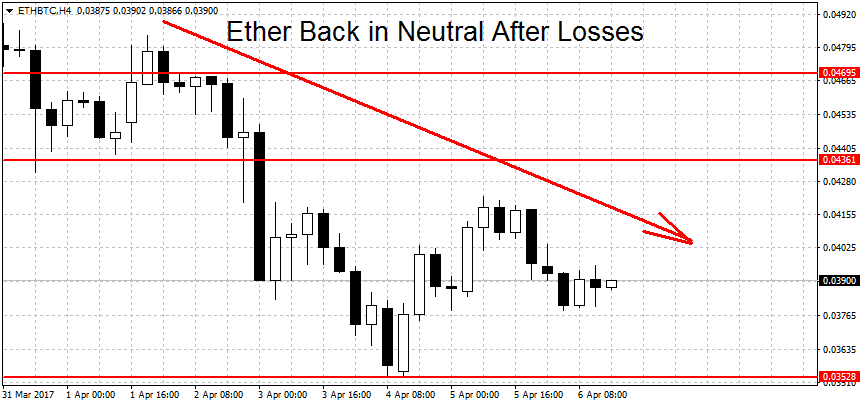
The two figures to watch now are 0.05805 BTC on the upside and 0.031 BTC on the downside. A move beyond either of these prices extremes would start a new uptrend/downtrend. Above here resistance can be found at the prior swing highs of 0.0469 and 0.436 BTC, as well as at the 0.0456 swing low. These levels are followed by the round 0.05 figure.
Below there is support at 0.034, last year’s high for this pair. Lower still there are weaker support levels at 0.0324 followed by the 0.031 swing low and the 0.03 round figure. While the daily trend shifted in neutral mode, the weekly and monthly remain bullish for ETH/BTC.
Dash Enters Downtrend
Dash prices have technically entered a downtrend last week. We fell to a low of 0.04177 BTC on April 3rd from a high of 0.12659. This was a 67 percent loss in value at the lows.
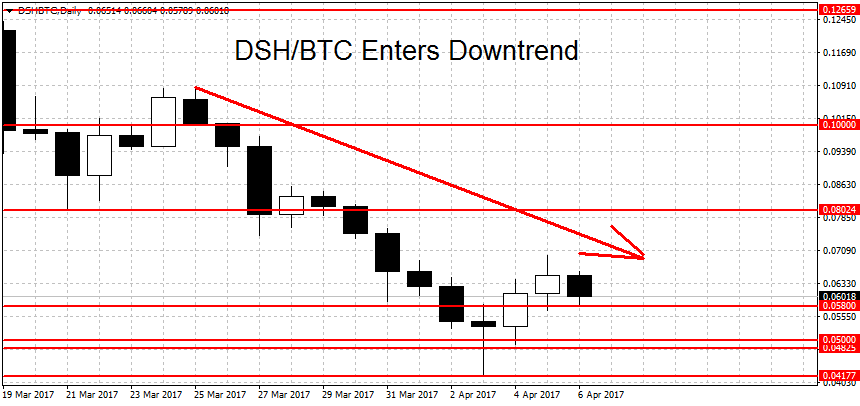
We are currently quoted a bit above the low at 0.0595 BTC. The bulls need a breakout above 0.09 BTC to end the current downtrend. But a new rally will not be in place until the 0.12659 BTC high is taken out as well. Below these levels we find weak resistance around 0.07 (near yesterday’s high at 0.06979). This is followed by 0.0743 and 0.075 BTC. The 0.08 round figure and the 0.08024 swing low are notable resistance levels too.
Below current prices we have weak support at the 0.05 BTC round figure, followed by a stronger level at the 0.04825 swing high and 0.04177, last month’s low for DSH/BTC. More support bellow here at 0.315, 0.02879 and 0.02478 BTC. The breakout point for the current rally at 0.0175 should now act as support to falling prices.
While the daily trend is now bearish, both the weekly and the monthly charts remain in bullish mode. However, the price action on these time-frames doesn’t make a good case for the bulls, with the weekly showcasing a large red bar.
FXOpen offers the world's most popular cryptocurrency CFDs*, including Bitcoin and Ethereum. Floating spreads, 1:2 leverage — at your service. Open your trading account now or learn more about crypto CFD trading with FXOpen.
*At FXOpen UK and FXOpen AU, Cryptocurrency CFDs are only available for trading by those clients categorised as Professional clients under FCA Rules and Professional clients under ASIC Rules respectively. They are not available for trading by Retail clients.
This article represents the opinion of the Companies operating under the FXOpen brand only. It is not to be construed as an offer, solicitation, or recommendation with respect to products and services provided by the Companies operating under the FXOpen brand, nor is it to be considered financial advice.
Latest articles

Look East! An Exciting Insight into FXOpen's New Hong Kong-listed Stock CFDs
Hong Kong has built up a gilt-edged reputation as one of the world's most reputable financial market centres. The city of Hong Kong enjoyed a unique position for many years. It is situated in the Asia Pacific region, very close

AUD/USD Rises Sharply on Inflation News
The Consumer Price Index for Australia was released this morning. According to ForexFactory:
→ CPI in quarterly terms: actual = 1.0%, expected = 0.8%, previous value = 0.6%;
→ CPI in annual terms: actual = 3.5%, expected = 3.4%, previous value = 3.

TSLA Share Price Up About 13% Despite Disappointing Report
Yesterday, TSLA trading closed at USD 144.68 per share, after which Tesla reported its results for the 1st quarter:
→ earnings per share: actual = USD 0.45, forecast = USD 0.49;
→ gross income: actual = USD 21.45 billion, forecast = USD