


FXOpen
Ether is continuing the strong rally versus bitcoin. The pair is trading at 0.8058 BTC at the moment. Meanwhile DSH/BTC is quoted at 0.04980, down slightly since our last update. The rally is Dash is already over but we’ll go over that in the second part of this article.
Ether Rally Continues
Ether is continuing the gains vs BTC, up by 14 percent since last Thursday. Naturally the bullish trend on the daily charts is still in place.

To end it the bears need to push ETH/BTC below the 0.06606 swing low. A breakdown below the yearly low at 0.05240 BTC is needed for a new downtrend. Some may wait for a break of the 0.05 BTC psychological figure before jumping in shorts (or bailing out on longs).
Weak resistance higher up can be found at today’s high of 0.08259 BTC, followed by the 0.08829 swing high and the 0.09 and 0.1 BTC round figures. Out of these two the 0.1 BTC round figure is more important. A decisive breakout above here may open to door to this year’s high at 0.121 BTC. On the longer-term charts the picture is still mixed. While the monthlies are keeping the bullish bias, the weeklies are still range-bound.
Dash Uptrend Falters
Unlike Ether, Dash didn’t manage to hold on to the initial strong gains after the breakout. Prices traded as high as 0.0588 BTC on April 23rd but only two days later a low of 0.05030 BTC was hit. Yesterday we dropped as low as 0.04949 BTC before recovering slightly. Currently we are hovering just around the 0.05 round figure.
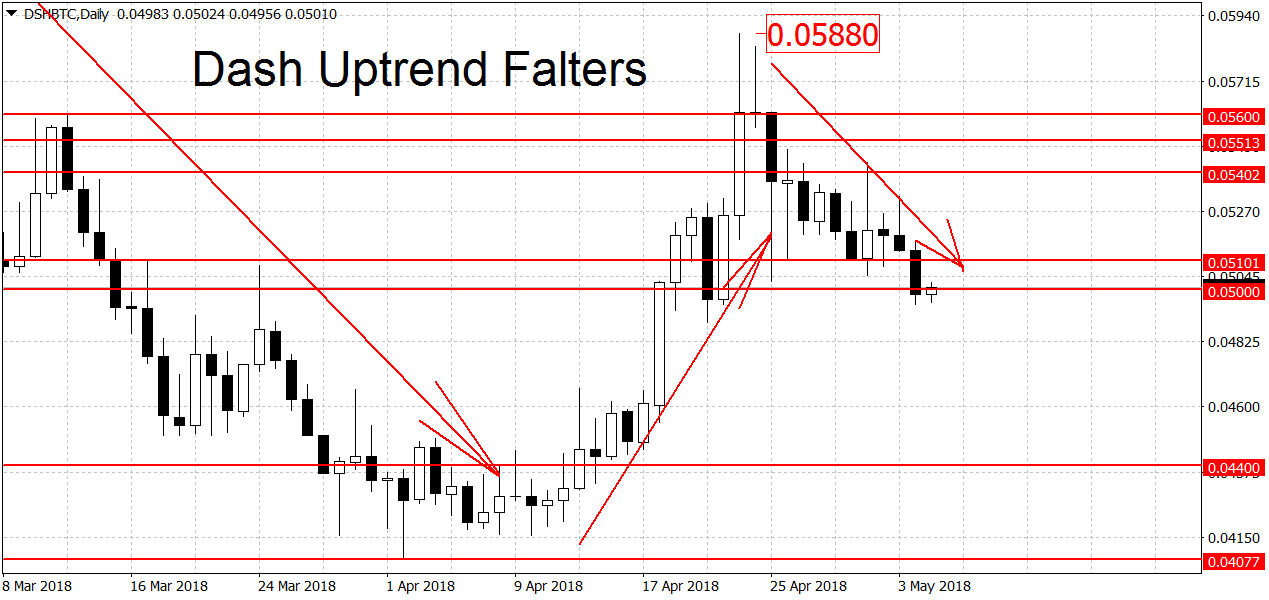
On the daily charts DSH/BTC is now range-bound. A new rally requires a breakout above the 0.0588 BTC swing high while a new downtrend needs a move below 0.044 BTC. Below here we find the yearly low for Dash at 0.04077 BTC, another notable support. A break below it could intensify the losses. Similarly to ETH, on the monthly charts Dash is bullish but on the weeklies prices are range-bound.
Bitcoin Slightly Down
Bitcoin is trading slightly lower compared to our last update. Today we topped out at $9,842 dollars but here fresh sellers stepped in. A low of $9,540 dollars was hit during the drop but we bounced back rather quickly. Bitcoin is quoted at $9,710 dollars at the moment.
The rally on the dailies will remain in place until the $8,650 dollars swing low is broken. A new downtrend requires a breakdown below $7,821 dollars per coin.
FXOpen offers the world's most popular cryptocurrency CFDs*, including Bitcoin and Ethereum. Floating spreads, 1:2 leverage — at your service. Open your trading account now or learn more about crypto CFD trading with FXOpen.
*At FXOpen UK and FXOpen AU, Cryptocurrency CFDs are only available for trading by those clients categorised as Professional clients under FCA Rules and Professional clients under ASIC Rules respectively. They are not available for trading by Retail clients.
This article represents the opinion of the Companies operating under the FXOpen brand only. It is not to be construed as an offer, solicitation, or recommendation with respect to products and services provided by the Companies operating under the FXOpen brand, nor is it to be considered financial advice.
Latest articles

Google Share Price Rose Post-market to a New All-time Record
Yesterday, after the close of the main trading session, a report on activities for the 1st quarter of Alphabet Inc. (Google's parent company) was published. The report was strong, exceeding investors' expectations.
→ Quarterly EPS = USD 1.89 (expected = USD 1.

S&P 500 Rebounds after Negative GDP News
Data released yesterday showed US GDP growth slowed to 1.6% in the first quarter of the year. According to ForexFactory: forecast = 2.2%, past value = 2.4%.
Reaction to the news sent the S&P 500 mini stock

GBP/USD And USD/CAD Daily Chart Outlook
GBP/USD is attempting a recovery wave from 1.2300. USD/CAD is consolidating and might aim for a move above the 1.3760 resistance zone.
Important Takeaways for GBP/USD and USD/CAD Analysis Today
· The British Pound started