


FXOpen
Both Ether and Dash and now back in rally mode versus bitcoin. The two altcoins had nice gains since our last update.
Ether Back in Rally Mode
Ether prices are back in an uptrend vs bitcoin. Since last Thursday we’ve gone up from 0.03968 to 0.04702 BTC, a gain of 18 percent.
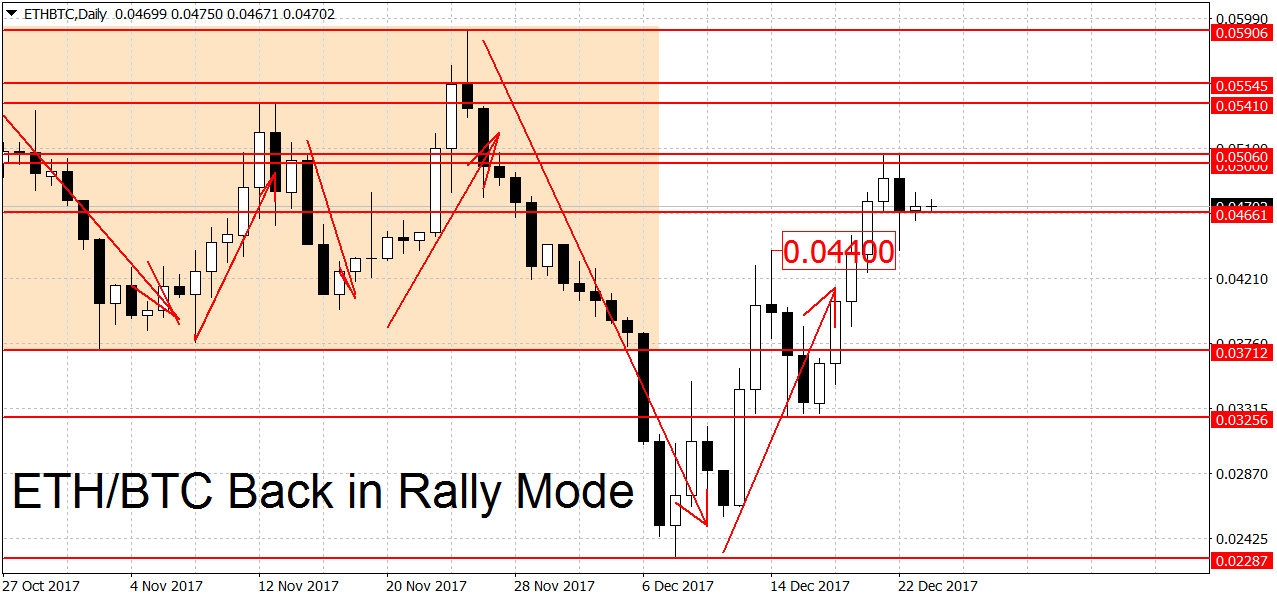
To end the current rally the bears will have to push ETH/BTC below the 0.03256 swing low. A new downtrend requires a break below this month’s low at 0.02287 BTC. Due to the high volatility in this crypto pair prudent traders would keep sizes much lower then usual.
We have resistance around the 0.05 round figure, closely followed by the former swing highs at 0.05410, 0.05545 and 0.05906. A breakout above here could lead to accelerated gains. On the way down we find weak support at 0.04661 and 0.04440, followed by stronger levels at the former 0.03712 and 0.03256 swing lows. The round figure at 0.03 and the multi-month low at 0.02287 BTC round off the important levels for ETH/BTC.
On the long-term charts the picture is mixed. The weekly charts are looking bearish but the monthlies still exhibit a slight bullish bias.
Dash Surges Higher
Dash prices surged higher versus bitcoin. One Dash is currently selling for 0.08085 BTC, up from 0.05495 BTC last week. This is a gain of 47 percent. Naturally this shifted the trend from down to up in DSH/BTC.
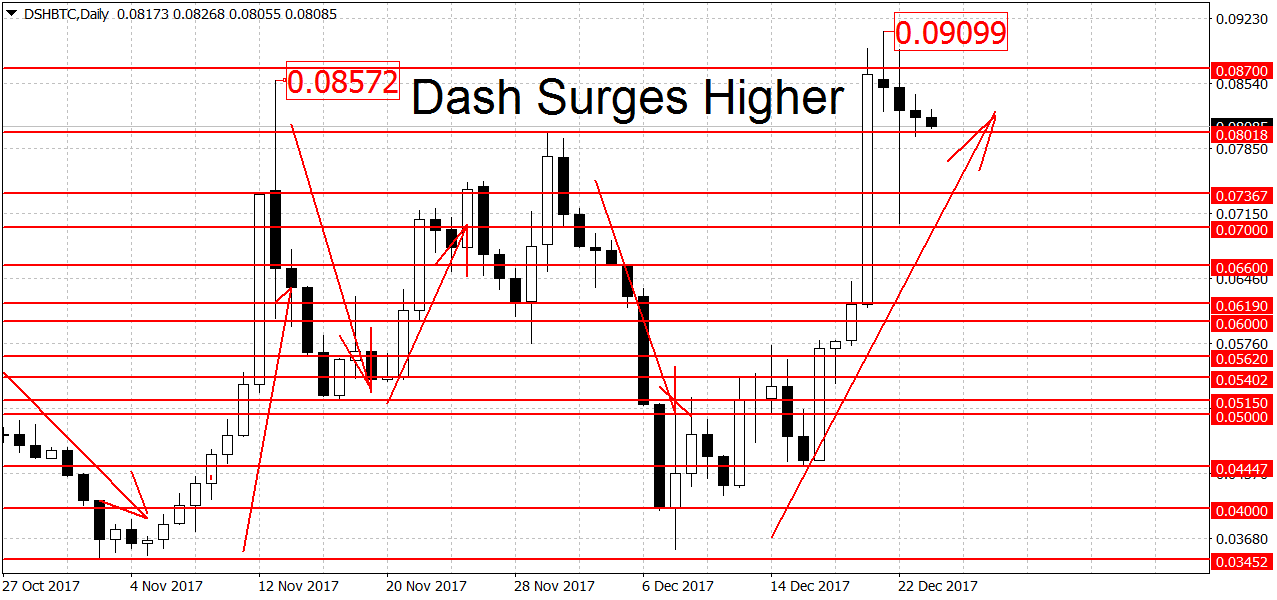
Two days a go a high of 0.9099 was hit, which may act as resistance going forward. Higher up we have more resistance at the 0.09720 swing high followed by the 0.1 round figure. Further up the all-time high at 0.1265 BTC as another notable level for Dash. A breakout above it may extend the gains.
On the lower end we find support around the 0.075 semi-round figure, followed by the 0.07040 BTC spike down and the 0.05760 swing low. To end the uptrend the bears will have to push the pair below the 0.04447 swing low. A new downtrend requires a break below 0.03557 BTC although cautious traders may want to wait for a break below the 0.03452 swing low as well. A clearing of this support area may lead to further losses in DSH/BTC.
Similarly to Ether, on the longer-term charts we have a mixed bag. Dash is looking bullish on the monthly but range-bound on the weekly chart.
FXOpen offers the world's most popular cryptocurrency CFDs*, including Bitcoin and Ethereum. Floating spreads, 1:2 leverage — at your service. Open your trading account now or learn more about crypto CFD trading with FXOpen.
*At FXOpen UK and FXOpen AU, Cryptocurrency CFDs are only available for trading by those clients categorised as Professional clients under FCA Rules and Professional clients under ASIC Rules respectively. They are not available for trading by Retail clients.
This article represents the opinion of the Companies operating under the FXOpen brand only. It is not to be construed as an offer, solicitation, or recommendation with respect to products and services provided by the Companies operating under the FXOpen brand, nor is it to be considered financial advice.
Latest articles

Anchored VWAP and How You Can Use It in Forex Trading
In the world of forex trading, understanding the nuanced tools at your disposal can significantly enhance decision-making processes. One such sophisticated tool is the Anchored Volume-Weighted Average Price (Anchored VWAP), which refines the standard VWAP by allowing traders to set

META Share Price Collapses after Publication of Quarterly Report
Just yesterday, META's stock price closed at USD 493.50, up approximately 40% since the start of 2024 and up nearly 300% since the start of 2023.
However, following the release of Meta's quarterly report, its shares plummeted to USD

USD/JPY Analysis: The Rate Exceeds The Level of 155 Yen Per US Dollar
Today, the price of USD/JPY once again renewed its 34-year high, exceeding the level of 155 yen per dollar, which put pressure on the current authorities.
According to Reuters, officials are trying to maintain calm in the market.
"We