


FXOpen
Both Ether and Dash are still in uptrends. But while Dash gained new ground during the past two weeks, Ether stayed mostly flat.
Ether Prices Mostly Stable After Rally
Ether prices have stayed mostly stable during the past two weeks. We are currently quoted at 0.01148, down by 5 percent compared to our last ETH update. This is not much considering that up to this point prices rallied 50 percent from the lows hit in December.
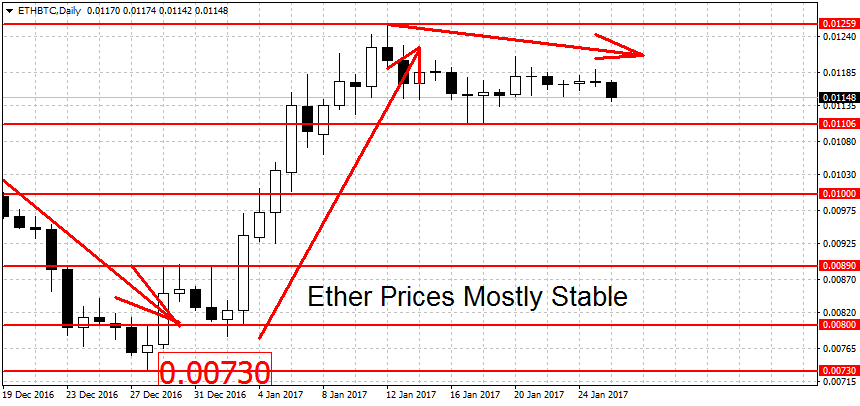
The uptrend remains unbroken as you can see on the chart above. But a decisive breakdown below the 0.01106 swing low could end it. Support below here can be found at at the 0.01 round figure,a move below here could shift the trend from up to down. The former swing highs near 0.0089 BTC could also provide some support to falling prices. The December low at 0.0073 is another potential support, followed by the semi-round figure at 0.05 BTC.
On the upper side we have resistance at this month’s high of 0.01259. Higher up we have more resistance at 0.01332 BTC, closely followed by the 0.01382 swing high and the 0.015 round figure. While the short-term (daily) trend is bullish here, the weekly trend remains bearish.
Dash Gains More Ground
Dash prices gained more ground during the past 14 days. We are currently trading at 0.01609, around 7.7 percent higher.
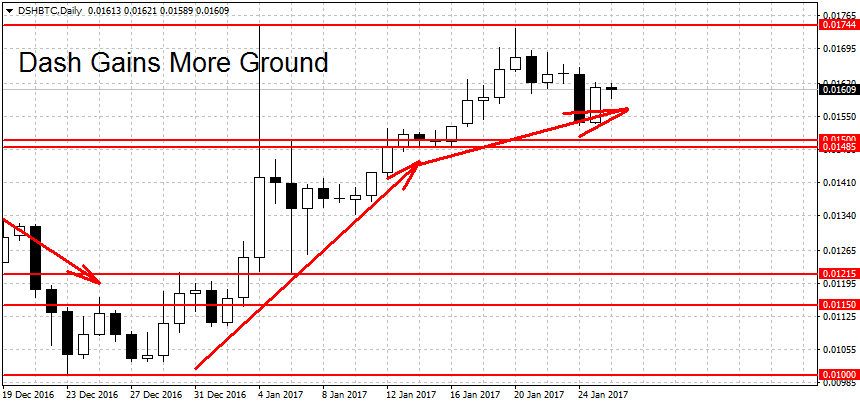
Dash is still in rally mode. To end it, the bulls will have to push prices below the 0.01485 swing low. We have support below here at the 0.01215 swing low. A decisive break below here could start a new downtrend. More support can be found at 0.01104, followed by a strong support level at the 0.01 BTC round figure. This is near last year’s low for DSH/BTC (0.01003). A breakdown below here could intensify the losses.
On the upper side, the double top near 0.01744 remains key. A successful breakout above it could propel Dash higher. The longer-term trends are still undecided, with both the weekly and the monthly charts in neutral mode.
Bitcoin Edges Higher
Bitcoin prices have edged higher during the past two days, from $900 to $905 dollars per coin. Prices remain range-bound. A new uptrend requires a decisive breakout above the $925 swing high, while a new downtrend needs a move below the $748 swing low. Note that the fundamental picture for bitcoin remains bleak, as we have outlined in our previous BTC article.
FXOpen offers the world's most popular cryptocurrency CFDs*, including Bitcoin and Ethereum. Floating spreads, 1:2 leverage — at your service. Open your trading account now or learn more about crypto CFD trading with FXOpen.
*At FXOpen UK and FXOpen AU, Cryptocurrency CFDs are only available for trading by those clients categorised as Professional clients under FCA Rules and Professional clients under ASIC Rules respectively. They are not available for trading by Retail clients.
This article represents the opinion of the Companies operating under the FXOpen brand only. It is not to be construed as an offer, solicitation, or recommendation with respect to products and services provided by the Companies operating under the FXOpen brand, nor is it to be considered financial advice.
Latest from Cryptocurrencies
Latest articles

Is There the Best Time to Trade Stock CFDs?
If you ask experienced traders, many will say that they trade on certain days or at certain times of the day. Their choice is determined by the market dynamics, volatility, and liquidity. It’s crucial to understand when the best

UnitedHealth (UNH) Share Price Surges after Strong Report
UnitedHealth shares surged Tuesday, rising more than 5% after the health care giant delivered stronger-than-expected first-quarter 2024 results:
→ earnings per share: actual = USD 6.91, expected = USD 6.61, last quarter = USD 6.16;
→ gross income: actual = USD 94.4

USD/JPY Analysis: Prospect of a Breakout of the Level of 155 Yen per Dollar
The USD/JPY rate has consistently reached new highs since 1990, approaching the psychological level of 155 yen per US dollar. The Japanese currency has already fallen about 9% against the dollar this year.
This is supported by Jerome Powell,