


FXOpen
Ether got a boost from the Devcon2 conference in Shanghai and managed to finally break to the upside. Dash, on the other hand, stabilized somewhat after losing over 30 percent in one month.
Ether Breaks Out
Ether broke above the 0.02204 monthly high on Tuesday as the Devcon2 conference got underway. But the lead-up to the event wasn’t a smooth sailing for the new cryptocurrency. Ethereum’s most popular client Geth suffered a DOS attack. This resulted in nodes running out of memory and crashing on the same block (2283416). Other Ethereum clients were not affected.
Prices initially crashed from 0.02135 to 0.01891 before a fix was published. This led to a quick rebound next day followed by the breakout we see on the chart below.
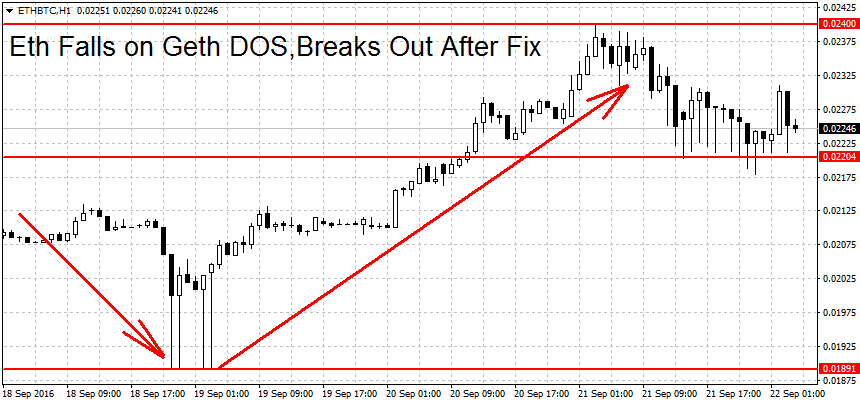
What’s next for ETH/BTC? We’re now in a short-term uptrend. Resistance above can be found at yesterday’s high of 0.024 followed by 0.02610 BTC. The resistance levels continue with the 0.028 and 0.03 round figures.
A break below the 0.01891 lows is needed to end the current uptrend. But a new downtrend requires a move below this month’s low at 0.018 BTC. Support levels can be found at the 0.015 round figure followed by 0.0139, 0.0123 and a second round level at 0.01 BTC. On the medium-term (weekly) charts ETH/BTC is neutral.
Dash Stabilizes Somewhat
Dash prices finally managed to stabilize somewhat after falling over 30 percent from the 0.02668 high reached last month. On FXOpen, the highest high in August was at 0.031 but this was likely due to low liquidity.
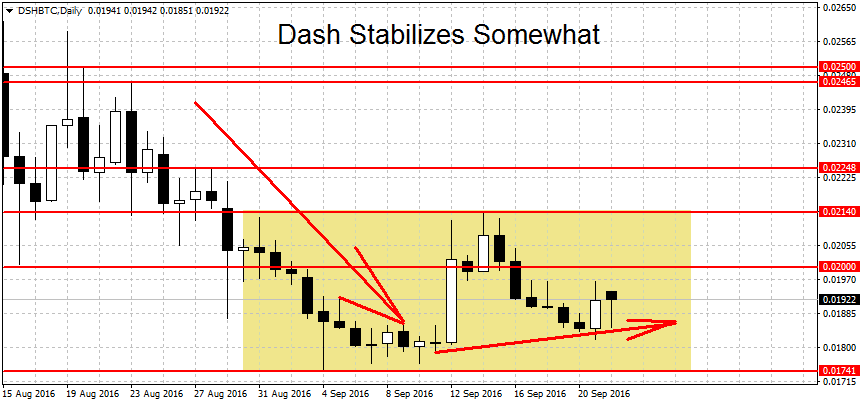
Dash is now in a neutral mode on short-term charts. The downtrend is over. But a new rally requires a break above this month’s high at 0.02140. Similarly, a break below this month’s low at 0.01741 would restart the downmove.
On the upside, we have a resistance at the 0.02248 swing high followed by 0.02465 and 0.025 BTC. Last month’s high at 0.02668 BTC and the all-time high at 0.028 are also worth a watch.
Below this month’s low (0.01741), we find a support at the 0.015 round figure followed by the 0.01389 spike high and the 0.01267 high reached back in June. The medium-term and long-term Dash charts look more bullish than bearish.
FXOpen offers the world's most popular cryptocurrency CFDs*, including Bitcoin and Ethereum. Floating spreads, 1:2 leverage — at your service. Open your trading account now or learn more about crypto CFD trading with FXOpen.
*At FXOpen UK and FXOpen AU, Cryptocurrency CFDs are only available for trading by those clients categorised as Professional clients under FCA Rules and Professional clients under ASIC Rules respectively. They are not available for trading by Retail clients.
This article represents the opinion of the Companies operating under the FXOpen brand only. It is not to be construed as an offer, solicitation, or recommendation with respect to products and services provided by the Companies operating under the FXOpen brand, nor is it to be considered financial advice.
Latest articles

Anchored VWAP and How You Can Use It in Forex Trading
In the world of forex trading, understanding the nuanced tools at your disposal can significantly enhance decision-making processes. One such sophisticated tool is the Anchored Volume-Weighted Average Price (Anchored VWAP), which refines the standard VWAP by allowing traders to set

META Share Price Collapses after Publication of Quarterly Report
Just yesterday, META's stock price closed at USD 493.50, up approximately 40% since the start of 2024 and up nearly 300% since the start of 2023.
However, following the release of Meta's quarterly report, its shares plummeted to USD

USD/JPY Analysis: The Rate Exceeds The Level of 155 Yen Per US Dollar
Today, the price of USD/JPY once again renewed its 34-year high, exceeding the level of 155 yen per dollar, which put pressure on the current authorities.
According to Reuters, officials are trying to maintain calm in the market.
"We