


FXOpen
Ether prices rallied over 13 percent versus bitcoin but then lost all the gains. Dash on the other hand is down over 5% vs BTC today.
Ether Rallies 13% then Loses All Gains
Ether prices rallied over 13% versus bitcoin yesterday and hit 0.121 BTC per coin. The highs were quickly sold into however as the general crypto market saw declines. Bitcoin is currently down almost 15% versus the U.S. Dollar and that usually triggers altcoin losses as well.
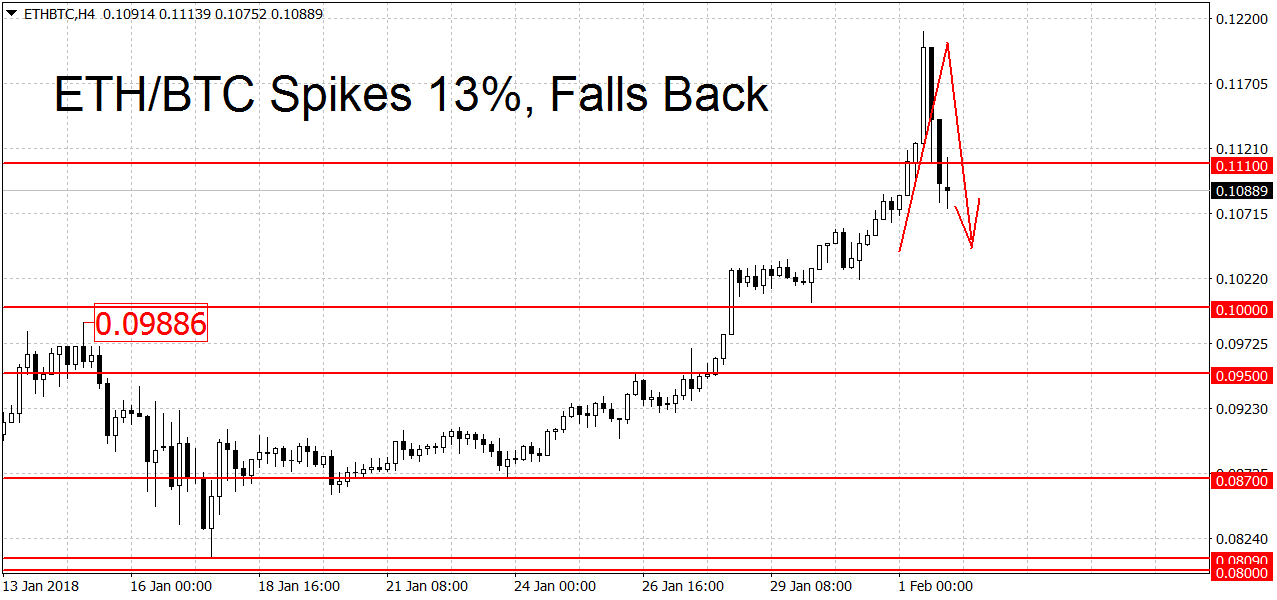
The ETH/BTC pair is quoted at 0.10889 right now, around the same price it had at the start of the day. As you can see on the chart above, the V-shaped formation shows that all gains during the past 24 hours have been lost.
Nonetheless the pair remains in an uptrend. To end it the bears will need to push us below the 0.087 BTC swing low. A break below 0.08 BTC may start a new downtrend. Above these levels we find support at 0.1 BTC, 0.09886 and 0.095 BTC. Higher up there’s resistance at yesterday’s high of 0.121 BTC followed by the 0.15 round figure and the 0.15098 all-time high. On the longer-term weekly and monthly charts ETH/BTC is still looking bullish.
Dash Down on the Day
While Ether ended the day mostly unchanged vs BTC (after a volatile session), Dash closed the session lower. One Dash is selling for 0.0649 right now, down from 0.06769 BTC this morning.
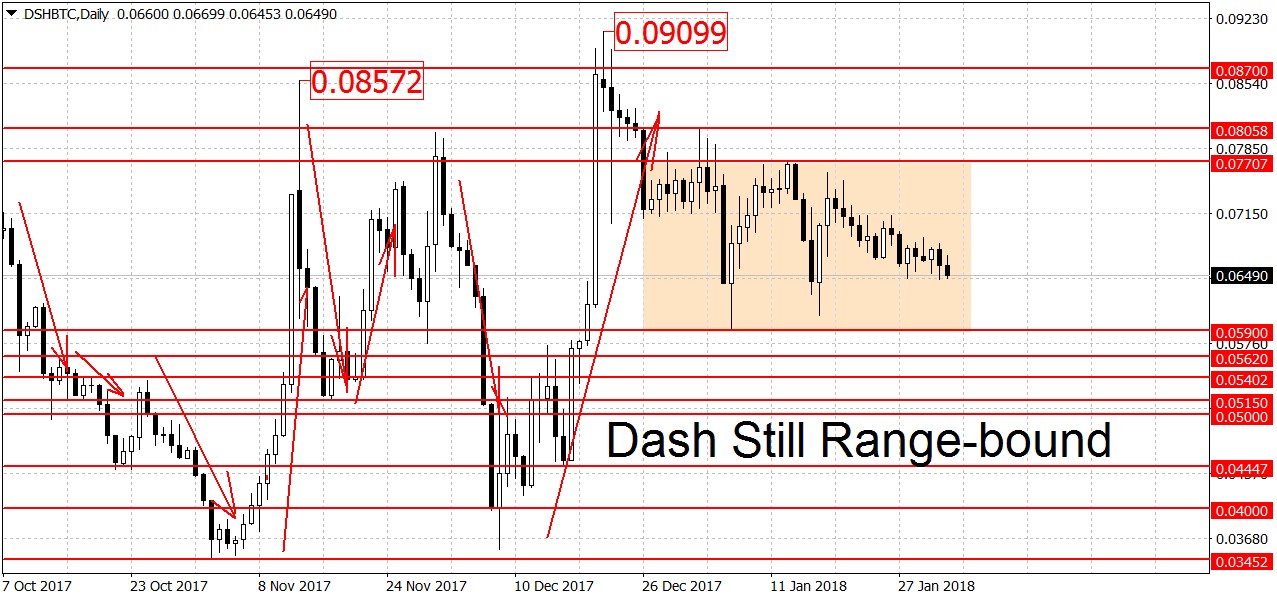
As can be seen on the chart above, DSH/BTC remains in a range on the daily charts. The bulls and the bears have been stuck in battle for the past month here. For now we remain in ‘wait and see’ mode here. The rectangle above shows the potential breakout points for this pair. A clean break below 0.059 BTC would start a new downtrend. Support below here can be found around the 0.05 round figure. A clearing of this support area could lead to more losses.
A break above 0.077 BTC may potentially start a new uptrend in prices. Close to here we have another resistance at 0.08058 BTC. Higher still we find more resistance levels at 0.08572, 0.087 and 0.09099 BTC. The 0.1 round figure is another potential resistance point. Dash is also range-bound on the weekly chart. Prices are looking bullish on the monthly charts however.
FXOpen offers the world's most popular cryptocurrency CFDs*, including Bitcoin and Ethereum. Floating spreads, 1:2 leverage — at your service. Open your trading account now or learn more about crypto CFD trading with FXOpen.
*At FXOpen UK and FXOpen AU, Cryptocurrency CFDs are only available for trading by those clients categorised as Professional clients under FCA Rules and Professional clients under ASIC Rules respectively. They are not available for trading by Retail clients.
This article represents the opinion of the Companies operating under the FXOpen brand only. It is not to be construed as an offer, solicitation, or recommendation with respect to products and services provided by the Companies operating under the FXOpen brand, nor is it to be considered financial advice.
Latest articles

Anchored VWAP and How You Can Use It in Forex Trading
In the world of forex trading, understanding the nuanced tools at your disposal can significantly enhance decision-making processes. One such sophisticated tool is the Anchored Volume-Weighted Average Price (Anchored VWAP), which refines the standard VWAP by allowing traders to set

META Share Price Collapses after Publication of Quarterly Report
Just yesterday, META's stock price closed at USD 493.50, up approximately 40% since the start of 2024 and up nearly 300% since the start of 2023.
However, following the release of Meta's quarterly report, its shares plummeted to USD

USD/JPY Analysis: The Rate Exceeds The Level of 155 Yen Per US Dollar
Today, the price of USD/JPY once again renewed its 34-year high, exceeding the level of 155 yen per dollar, which put pressure on the current authorities.
According to Reuters, officials are trying to maintain calm in the market.
"We