


FXOpen

It’s a mixed bag this Thursday for Ether and Dash. While Ether is trading a bit higher since our update last week, Dash continues to range.
Ether Bounces From Lows
Ether prices versus bitcoin bounced from the 0.058 lows on FXOpen to 0.081 right now. The lows on other exchanges were around the 0.066 level.
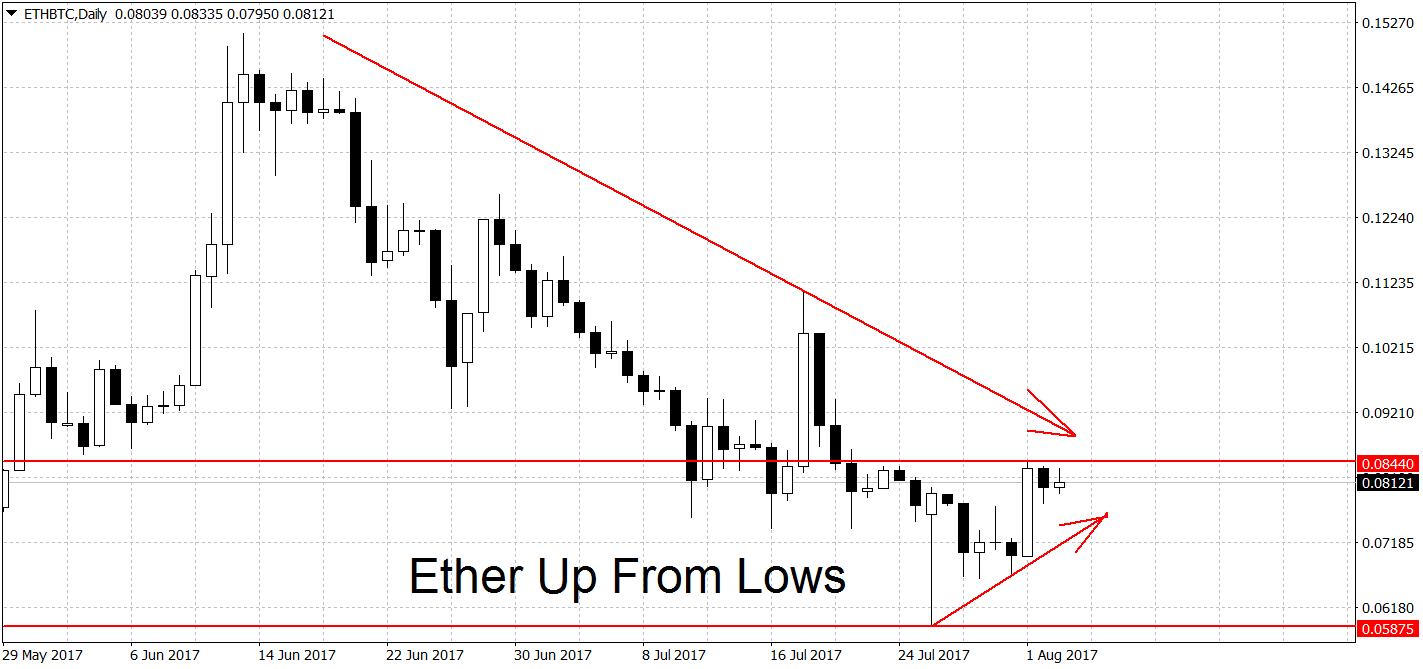
Despite the bounce, however, we’re still in a downtrend on the daily charts. The bulls need a break above the 0.0844 swings high to end the current trend. A new rally requires a break of the 0.111 spike high as well. On the long-term weekly and monthly charts, ETH/BTC is still looking bullish.
Dash Range-bound
We haven’t done a Dash update in a while due to lots of developments in the bitcoin space. Nonetheless, you haven’t missed much as prices here are still in a range. On the chart below we can see that DSH/BTC spent most of the past two months stuck between 0.06 and 0.08134.
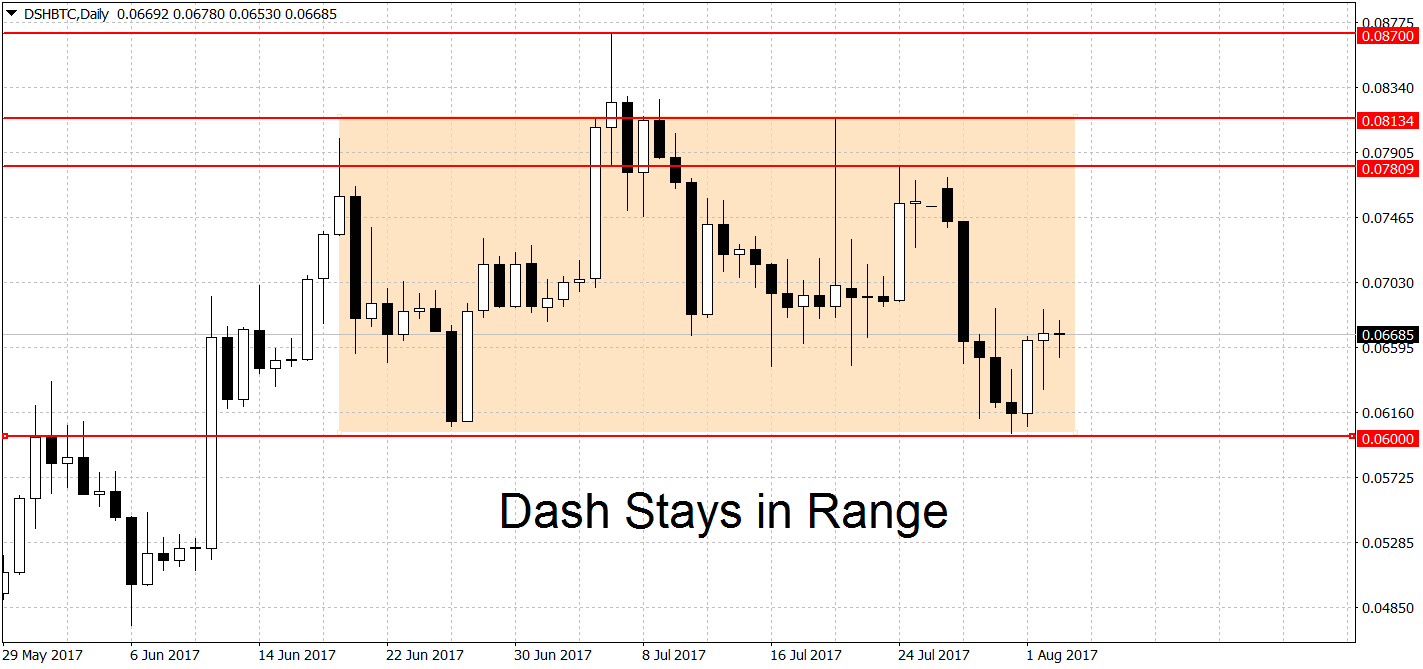
These remain as the two key levels for this pair. A decisive breakout above 0.08134 should start a new Dash rally. Note that, as usual, we’re looking for a sustained break of this price level and not just a brief and shallow spike above.
A new downtrend needs a break below the strong support at 0.06 BTC. This level got tested twice already (at 0.0606 and 0.0602) on the daily charts and held strong so far. A clean break below here could lead to more gains to the 0.05 round figure and even below. On the long-term charts, DSH/BTC is in rally mode as well.
Bitcoin Still in Uptrend
No crypto update is complete without big brother bitcoin. The number one crypto is still holding strong at $2,748, way above the potentially trend-ending level at $2,400. Not much has happened since our last update on Tuesday, with prices in ‘wait and see’ mode after the fork. We’re currently quoted higher by around 1% since then.
The key levels to keep an eye on are $3,000 on the upside and $2,400 on the downside. A decisive break below $2,400 would end the trend on the daily charts. On the other hand, a breakout above the $3,000 round figure could reignite the ‘FOMO‘ and lead to more gains. On the long-term weekly and monthly charts, BTC/USD is in a bullish trend.
FXOpen offers the world's most popular cryptocurrency CFDs*, including Bitcoin and Ethereum. Floating spreads, 1:2 leverage — at your service. Open your trading account now or learn more about crypto CFD trading with FXOpen.
*At FXOpen UK and FXOpen AU, Cryptocurrency CFDs are only available for trading by those clients categorised as Professional clients under FCA Rules and Professional clients under ASIC Rules respectively. They are not available for trading by Retail clients.
This article represents the opinion of the Companies operating under the FXOpen brand only. It is not to be construed as an offer, solicitation, or recommendation with respect to products and services provided by the Companies operating under the FXOpen brand, nor is it to be considered financial advice.
Latest articles

Anchored VWAP and How You Can Use It in Forex Trading
In the world of forex trading, understanding the nuanced tools at your disposal can significantly enhance decision-making processes. One such sophisticated tool is the Anchored Volume-Weighted Average Price (Anchored VWAP), which refines the standard VWAP by allowing traders to set

META Share Price Collapses after Publication of Quarterly Report
Just yesterday, META's stock price closed at USD 493.50, up approximately 40% since the start of 2024 and up nearly 300% since the start of 2023.
However, following the release of Meta's quarterly report, its shares plummeted to USD

USD/JPY Analysis: The Rate Exceeds The Level of 155 Yen Per US Dollar
Today, the price of USD/JPY once again renewed its 34-year high, exceeding the level of 155 yen per dollar, which put pressure on the current authorities.
According to Reuters, officials are trying to maintain calm in the market.
"We