


FXOpen
The gains for bitcoin continue and with it we’re seeing most altcoins under pressure. Ether is testing the lows reached last month while Dash is somewhat stable but not far from its lows either. Let’s start with ETH/BTC and we’ll get back to Dash later in the article.
Ether Testing Lows
Ether prices are testing the lows reached during October. One coin is now quoted at 0.01349 per BTC, just barely above the 0.01332 low hit last month. Few hours ago we traded as low as 0.01338.
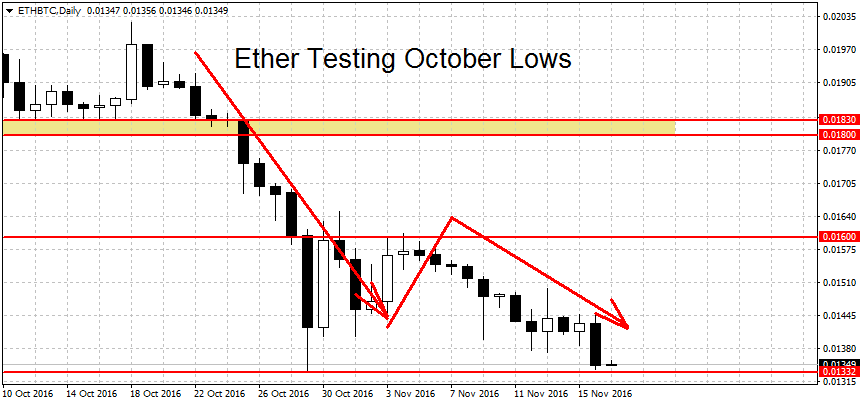
On the shorter-term (daily) charts Ether is still firmly in a downtrend. Below the 0.01332 low we have more support at 0.0123 closely followed by the round level at 0.01 BTC. On the medium-term charts (weekly) price action is slated to the downside but no clear trend can be seen.
To end the current downtrend ETH will have to break above 0.016 BTC. The 0.018 former support has now turned into resistance and will likely present a serious challenge to the bulls. A decisive breakout of this level would start a new uptrend. Further up we find more resistance at the 0.02 round figure, closely followed by the 0.02024 swing high. Higher still more resistance can be found at the 0.02228 swing high, 0.024 and 0.02610 BTC.
Dash Mostly Stable
Dash has stabilized somewhat during the past two weeks. Prices have ended the short-term downtrend and we’re now looking for the next move higher/lower. On the picture below the last two weeks are marked with a yellow rectangle. While we had a lot of volatility, we’re now trading at 0.01264, 2.3 percent above the price noted in our previous Dash article.
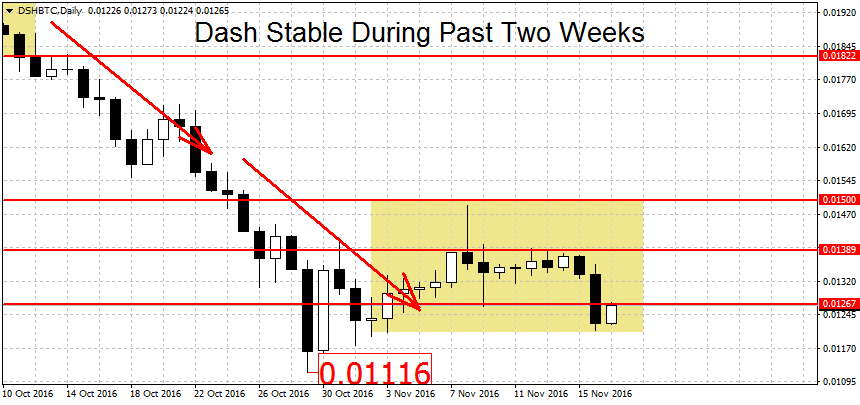
To resume the downward move, the bears will need to break last month’s low at 0.01116 BTC. Not far below here the 0.01 round figure should act as support as well.
For the bulls the hurdle to a new uptrend is set higher at the 0.01489 swing high. A clear breakout above 0.015 BTC for example could start a new rally. More resistance above here can be found at the September lows of 0.01741 per BTC, closely followed by the 0.01822 swing low and the 0.02 round figure.
Both the short-term and the medium-term trends for DSH/BTC are now neutral. On the long-term (monthly) charts, a slight bullish bias is still present.
FXOpen offers the world's most popular cryptocurrency CFDs*, including Bitcoin and Ethereum. Floating spreads, 1:2 leverage — at your service. Open your trading account now or learn more about crypto CFD trading with FXOpen.
*At FXOpen UK and FXOpen AU, Cryptocurrency CFDs are only available for trading by those clients categorised as Professional clients under FCA Rules and Professional clients under ASIC Rules respectively. They are not available for trading by Retail clients.
This article represents the opinion of the Companies operating under the FXOpen brand only. It is not to be construed as an offer, solicitation, or recommendation with respect to products and services provided by the Companies operating under the FXOpen brand, nor is it to be considered financial advice.
Latest from Cryptocurrencies
Latest articles

Market Analysis: AUD/USD and NZD/USD Turn Red
AUD/USD declined below the 0.6500 and 0.6455 support levels. NZD/USD is also moving lower and might struggle to recover above 0.5950.
Important Takeaways for AUD/USD and NZD/USD Analysis Today
· The Aussie Dollar started

Since the Start of the Week, Brent Oil Price Has Dropped over 4%
At the beginning of the week, March 15, we wrote that the price of Brent oil could form a correction from the resistance level of USD 91 per barrel. Since then, the price has decreased by more than 4% due

Fair Value Gaps vs Liquidity Voids in Trading
Understanding fair value gaps and liquidity voids is essential for traders seeking to navigate the complexities of the financial markets. These concepts, deeply rooted in the Smart Money Concept (SMC), provide valuable insights into the dynamics of supply and demand,