


FXOpen
The Euro and British Pound are recovering higher, but they are facing key resistances against the Japanese Yen. Both EUR/JPY and GBP/JPY could decline in the short term before an upward move.
Important Takeaways for EUR/JPY and GBP/JPY
- The Euro is finding strong bids near the 131.70 support against the Japanese Yen.
- There is a major bearish trend line in place with resistance at 132.40 on the hourly chart of EUR/JPY.
- GBP/JPY is facing a key resistance zone near the 148.75 level.
- There is a major breakout pattern forming with resistance at 148.80 on the hourly chart.
EUR/JPY Technical Analysis
The Euro remained in an uptrend and traded above the 132.00 and 132.50 resistances against the Japanese Yen. However, the EUR/JPY pair faced a strong resistance near the 133.00 and 133.10 levels.
The pair failed to hold gains above 133.00 and started a downside move. It declined, broke the 132.50 support area, and also settled below the 50 hourly simple moving average.
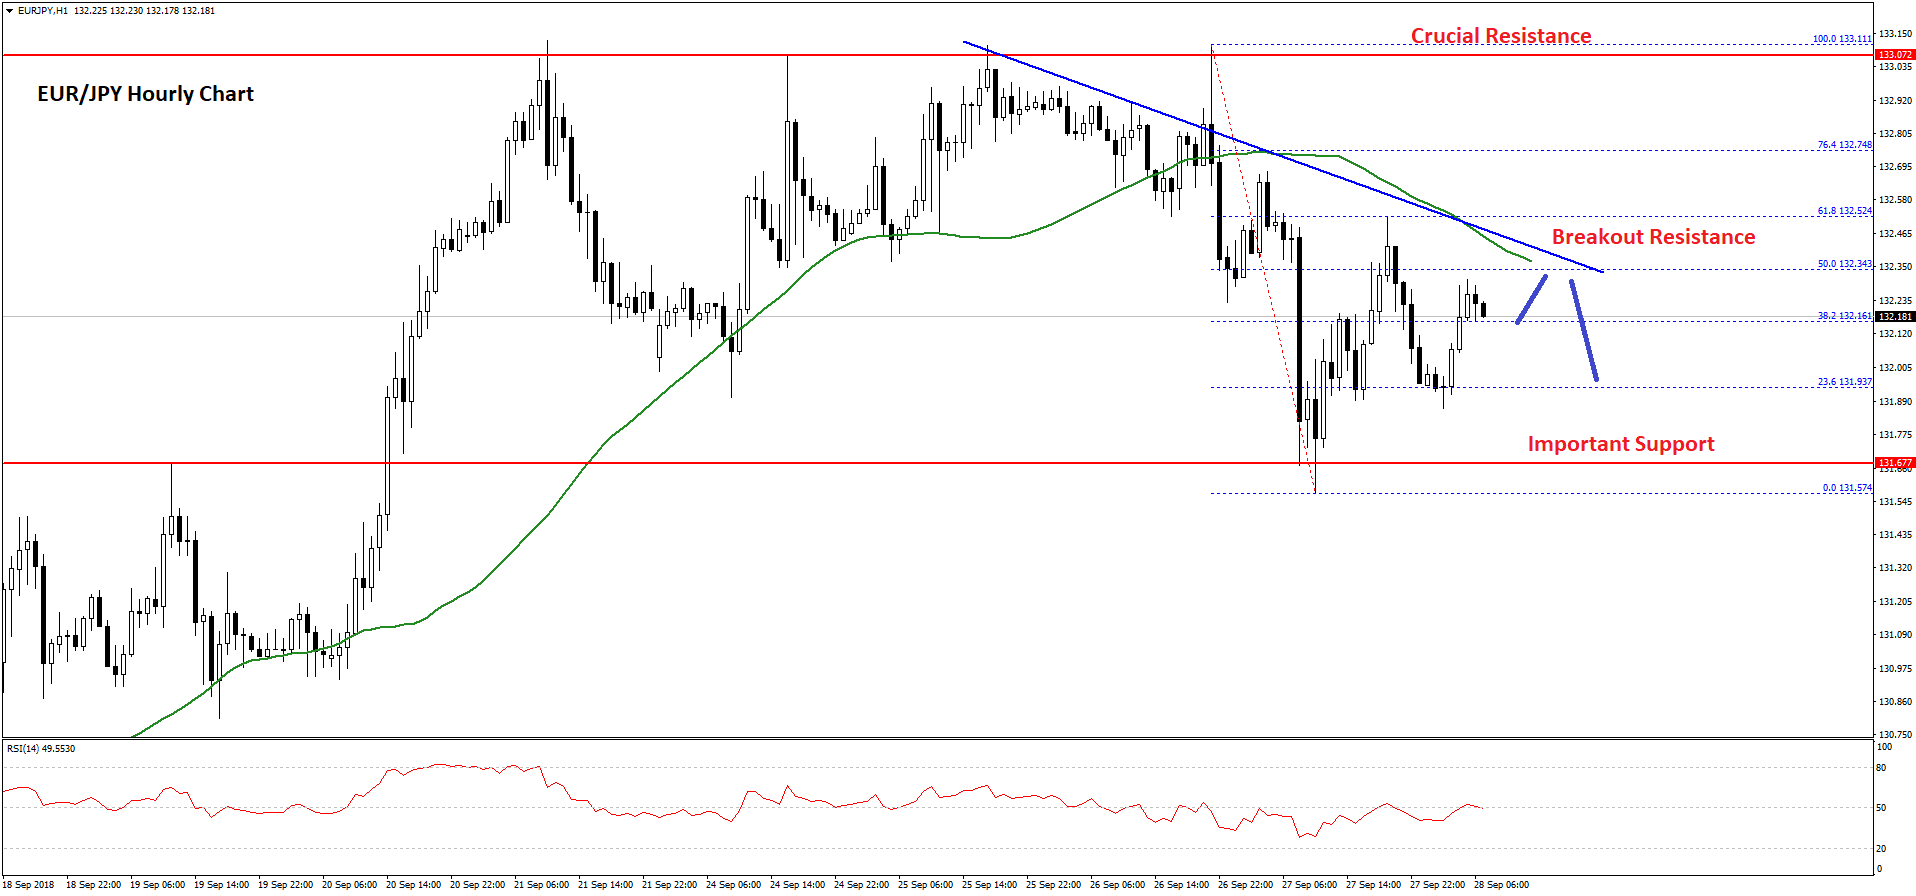
The decline was strong as the pair traded below 132.00, but buyers protected losses near a major support area at 131.70. The pair formed a base above 131.70 and later started a fresh upward move. It traded above the 50% Fib retracement level of the last decline from the 133.11 high to 131.57 low.
However, the pair failed to move above the 132.50 level and the 50 SMA. There is also a major bearish trend line in place with resistance at 132.40 on the hourly chart of EUR/JPY. Moreover, the 61.8% Fib retracement level of the last decline from the 133.11 high to 131.57 low acted as a resistance.
Therefore, the pair seems to be facing a major hurdle near the 132.40-50 zone. A break above 132.50 is needed for an acceleration towards the 133.00 resistance. On the downside, the 132.00 and 131.70 levels are strong supports. Below the last, the pair may trade towards the 131.20 support.
GBP/JPY Technical Analysis
The British Pound followed a positive structure above the 147.50 support against the Japanese Yen. The GBP/JPY pair traded above the 148.00 and 148.50 resistance levels.
However, the pair failed to break the 149.00-149.10 resistance region and dropped back towards the 147.50 support. A low was formed at 147.59 and the pair corrected higher. It moved above the 50% Fib retracement level of the last slide from the 149.09 high to 147.59 low.
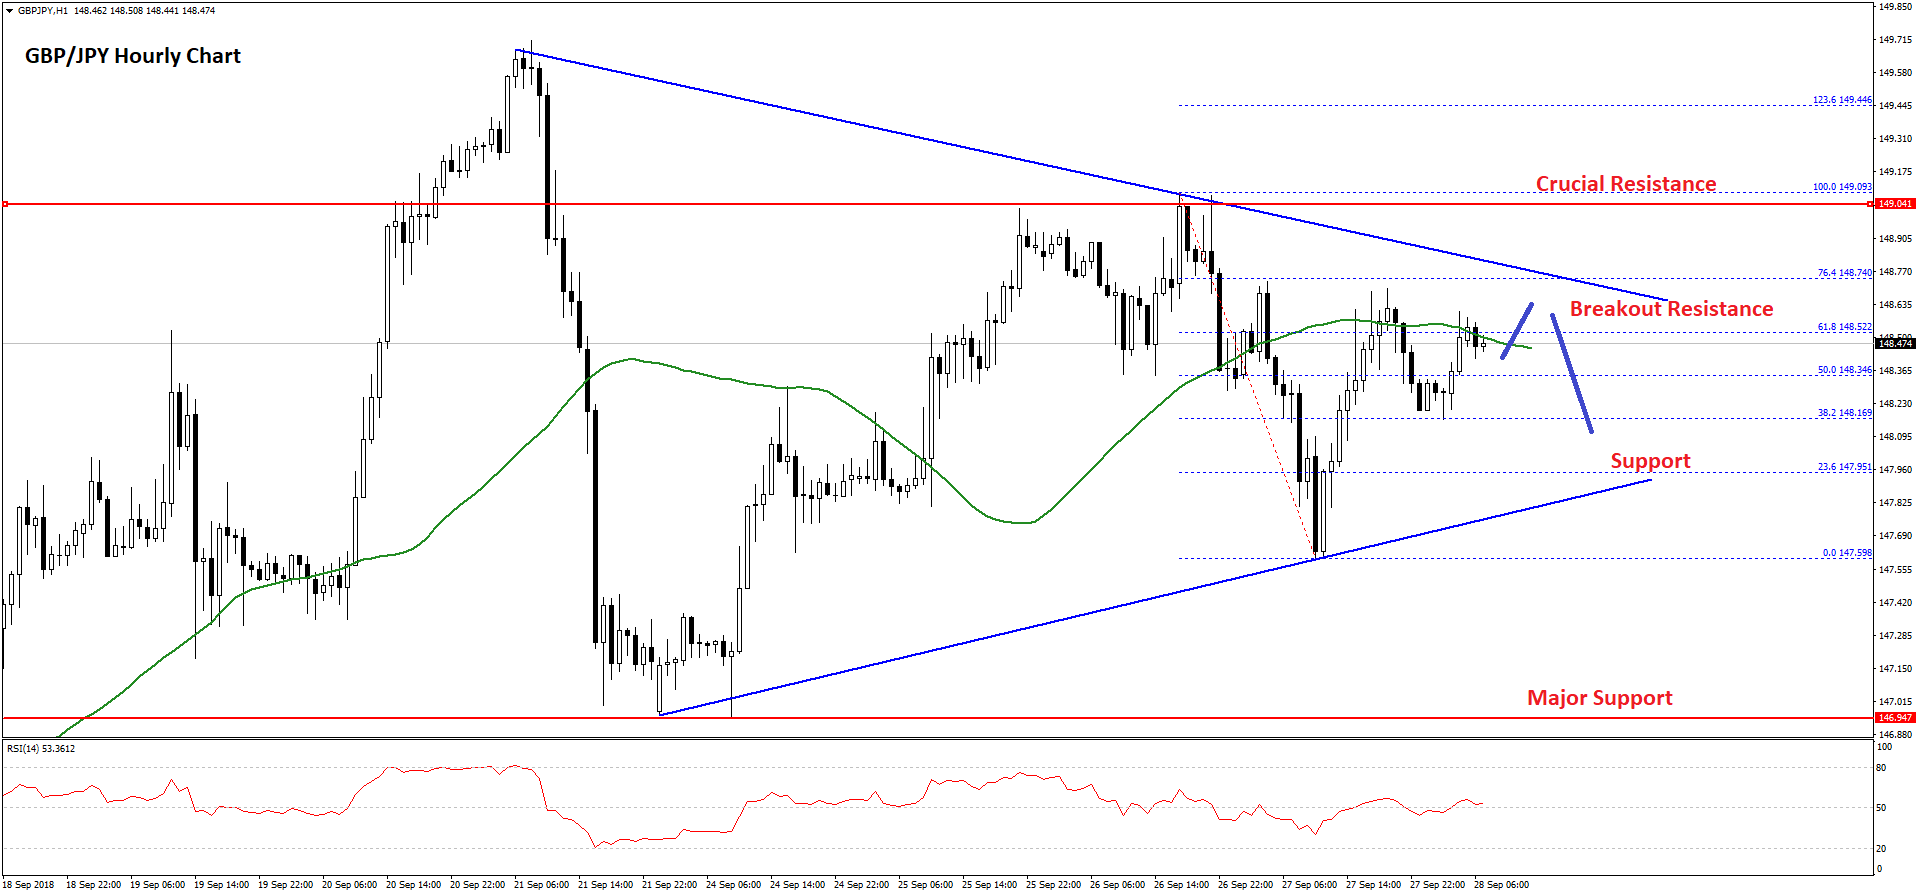
At present, the pair is struggling to settle above the 50 hourly SMA and the 148.70 level. Moreover, the 76.4% Fib retracement level of the last slide from the 149.09 high to 147.59 low is also at 148.74.
It seems like the pair is forming a major breakout pattern forming with resistance at 148.80 on the hourly chart. On the upside, a break above 148.80 is needed for more gains above the 149.00 level in the near term. The next major resistance on the upside is near 150.00.
On the other hand, the 147.90 and 147.70 levels are important supports. If there is a downside break below 147.70, there could be more losses in GBP/JPY towards the 147.20 and 147.00 levels.
The overall price action is positive for EUR/JPY and GBP/JPY, but there may be a short-term dip before both attempts an upward move.
Trade over 50 forex markets 24 hours a day with FXOpen. Take advantage of low commissions, deep liquidity, and spreads from 0.0 pips. Open your FXOpen account now or learn more about trading forex with FXOpen.
This article represents the opinion of the Companies operating under the FXOpen brand only. It is not to be construed as an offer, solicitation, or recommendation with respect to products and services provided by the Companies operating under the FXOpen brand, nor is it to be considered financial advice.
Latest from Forex Analysis
Latest articles

Look East! An Exciting Insight into FXOpen's New Hong Kong-listed Stock CFDs
Hong Kong has built up a gilt-edged reputation as one of the world's most reputable financial market centres. The city of Hong Kong enjoyed a unique position for many years. It is situated in the Asia Pacific region, very close

AUD/USD Rises Sharply on Inflation News
The Consumer Price Index for Australia was released this morning. According to ForexFactory:
→ CPI in quarterly terms: actual = 1.0%, expected = 0.8%, previous value = 0.6%;
→ CPI in annual terms: actual = 3.5%, expected = 3.4%, previous value = 3.

TSLA Share Price Up About 13% Despite Disappointing Report
Yesterday, TSLA trading closed at USD 144.68 per share, after which Tesla reported its results for the 1st quarter:
→ earnings per share: actual = USD 0.45, forecast = USD 0.49;
→ gross income: actual = USD 21.45 billion, forecast = USD