


FXOpen
The Euro and British Pound are under a lot of bearish pressure against the Japanese Yen. Both EUR/JPY and GBP/JPY remain at a risk of more declines in the near term.
Important Takeaways for EUR/JPY and GBP/JPY
- The Euro failed to hold gains above the 129.00 resistance and declined against the Japanese Yen.
- EUR/JPY may perhaps accelerate losses below the 127.80 support area in the short term.
- GBP/JPY is following a declining path and it is likely to decline below 142.00.
- On the upside, there is a significant resistance formed near 142.80.
EUR/JPY Technical Analysis
There were a couple of swing moves above the 128.55 support area in the Euro against the Japanese Yen. However, the EUR/JPY pair failed to settle above the 129.00 resistance and the 50 hourly simple moving average.
As a result, there was a major downside move initiated and the pair tumbled below the 128.55 support area. The decline was such that the pair settled below the 128.20 support and the 50 hourly SMA.
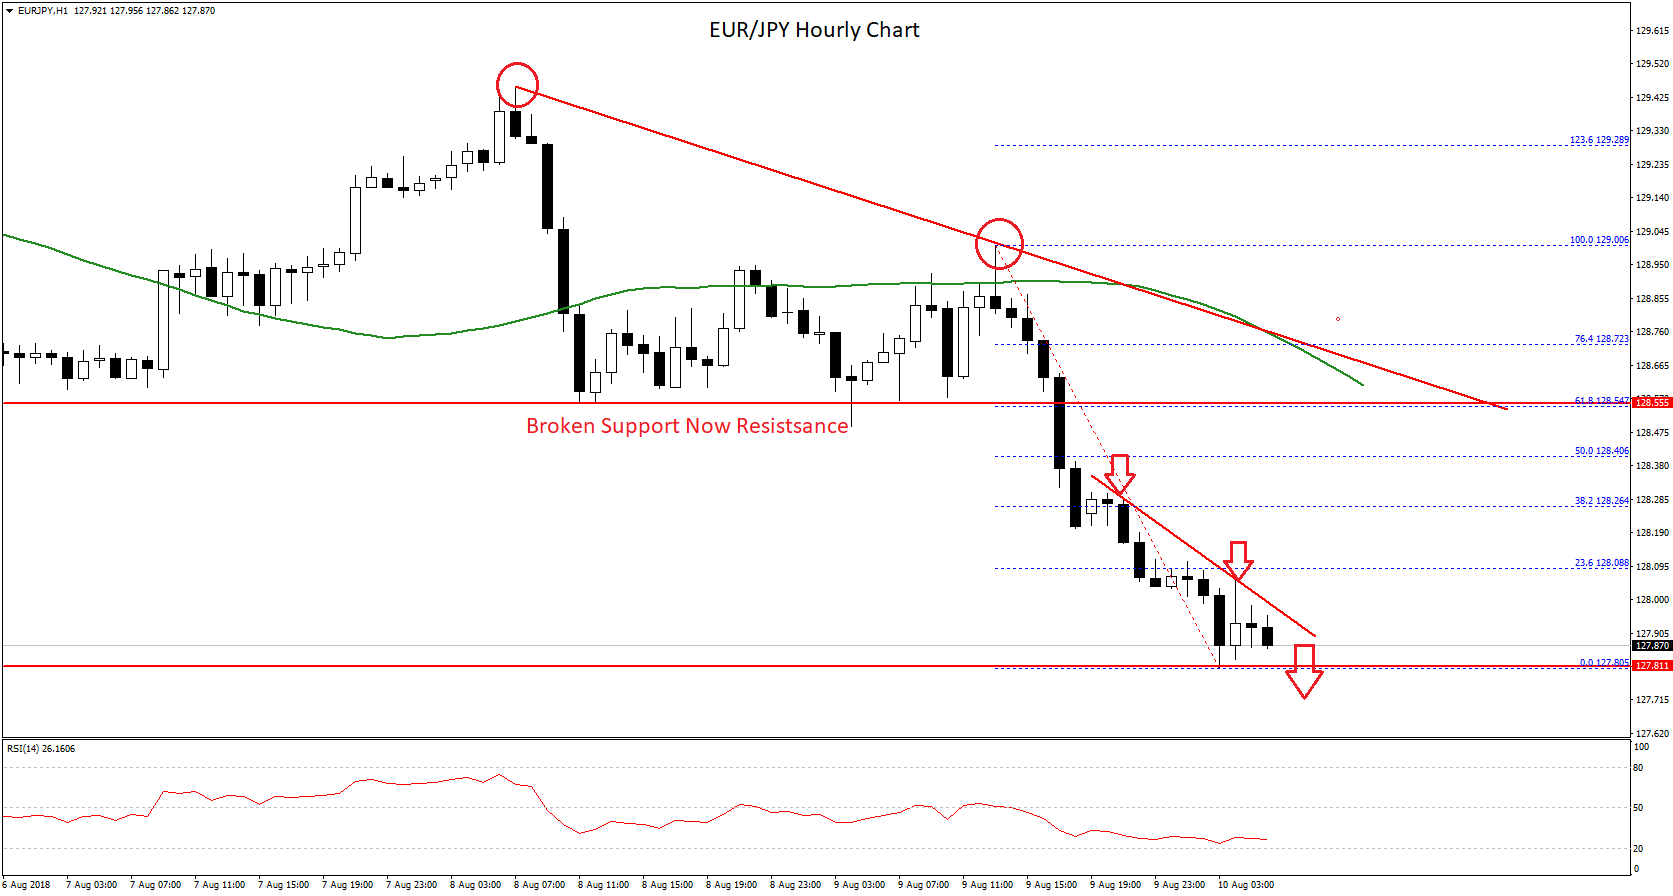
It traded as low as 127.80 and it is currently consolidating losses. On the upside, an initial resistance is near a bearish trend line with resistance at 128.00. Above this, the pair could test the 23.6% Fib retracement level of the last drop from the 129.00 high to 127.80 low.
However, the most important resistance is near the 128.55 level, which was a support earlier. There is also a bearish trend line positioned around the same trend line and the 61.8% Fib retracement level of the last drop from the 129.00 high to 127.80 low.
Moreover, the 50 hourly SMA is also near the 128.60 level. Therefore, there are many hurdles on the upside for the Euro buyers near the 128.20 and 128.50 levels.
On the downside, a break below the recent low of 127.80 could open the doors for more declines. The next supports are at 127.50 and 127.20.
GBP/JPY Technical Analysis
The British Pound declined sharply from the 143.50 swing high against the Japanese Yen. The GBP/JPY pair failed to move past 143.50 and the 50 hourly SMA, which resulted in a sharp downside move.
The pair broke the 143.10 support area to initiate a bearish wave. Later, sellers took control and pushed the pair below the 50% and 61.8% Fib retracement level of the last wave from the 142.35 low to 143.49 high.
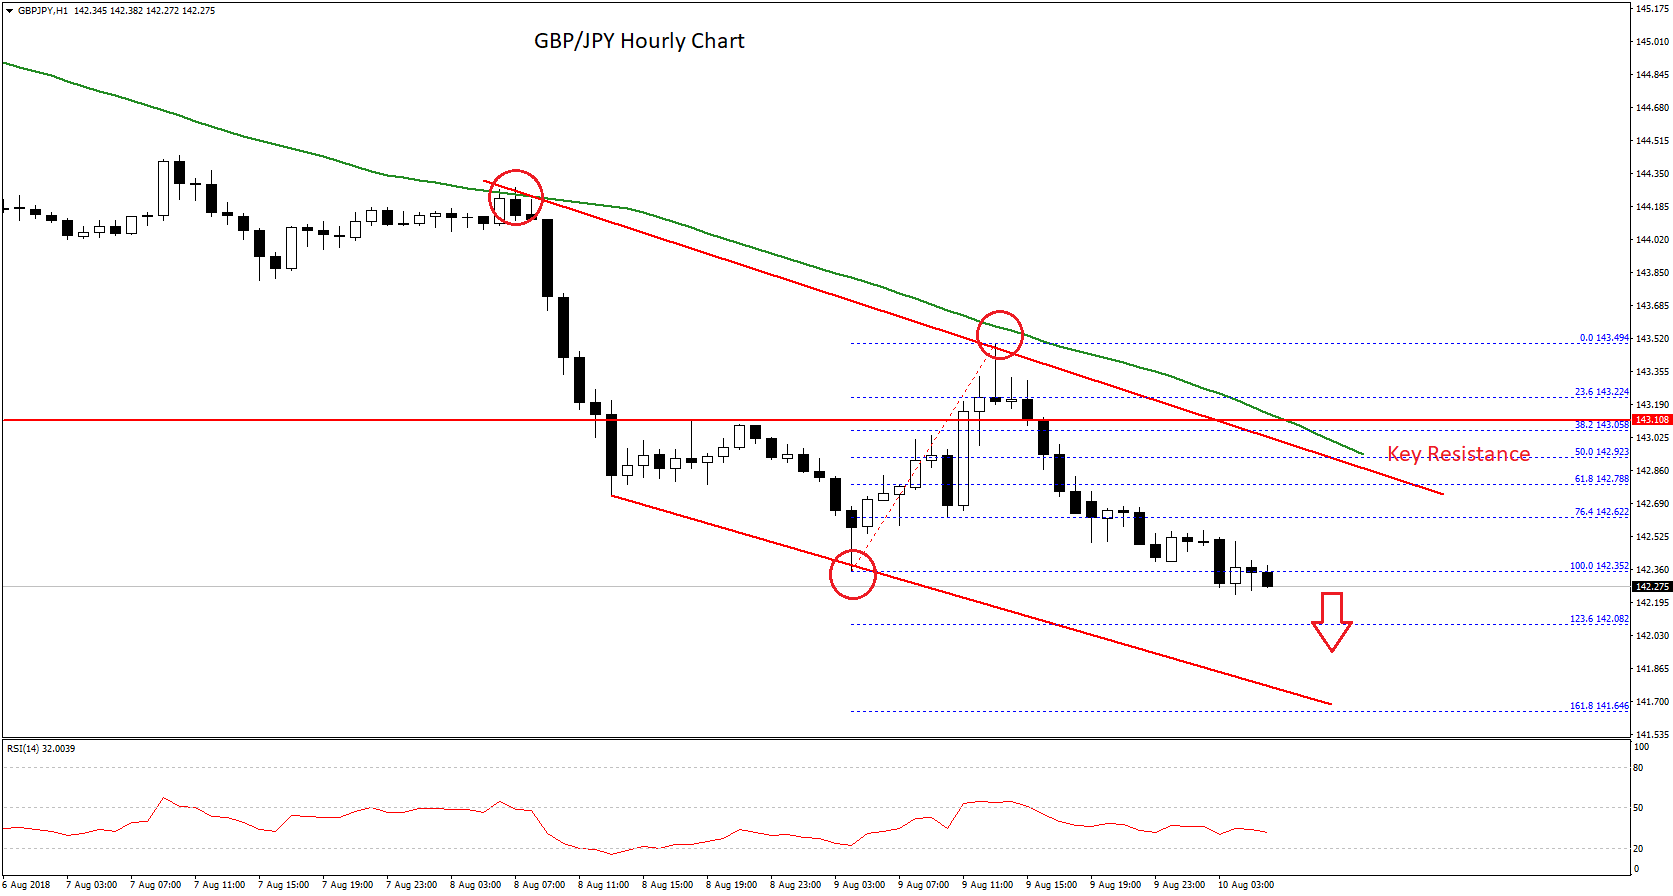
At the moment, the pair is trading below the last swing low of 142.35. It means the pair may well decline further towards the 1.236 Fib extension level of the last wave from the 142.35 low to 143.49 high at 142.08. Below this, the next support is near the 141.65-50 levels.
On the upside, an initial resistance is near the 142.60 level. Above this, there is a crucial resistance formed near 142.80 and a bearish trend line. Moreover, the 50 hourly SMA is sitting near 142.88.
Therefore, if the pair moves higher, it is likely to face sellers near 142.60 and 142.80. Only a close above 142.80 and the 50 hourly SMA could trigger bullish moves in the near term.
Overall, it seems like both EUR/JPY and GBP/JPY are trading in a bearish zone below 128.50 and 142.80 respectively. Upsides are likely to remain limited in the near term and both pairs could decline further towards 127.50 and 142.00 respectively.
Trade over 50 forex markets 24 hours a day with FXOpen. Take advantage of low commissions, deep liquidity, and spreads from 0.0 pips. Open your FXOpen account now or learn more about trading forex with FXOpen.
This article represents the opinion of the Companies operating under the FXOpen brand only. It is not to be construed as an offer, solicitation, or recommendation with respect to products and services provided by the Companies operating under the FXOpen brand, nor is it to be considered financial advice.
Latest from Forex Analysis
Latest articles

The Dollar is Corrected after the Comments of the Head of the Federal Reserve
Good data on the labour market in the United States and the continuous rise in inflation for several months are helping to reduce experts’ expectations about a change in the vector of monetary policy in the United States. Recent comments

Is There the Best Time to Trade Stock CFDs?
If you ask experienced traders, many will say that they trade on certain days or at certain times of the day. Their choice is determined by the market dynamics, volatility, and liquidity. It’s crucial to understand when the best

UnitedHealth (UNH) Share Price Surges after Strong Report
UnitedHealth shares surged Tuesday, rising more than 5% after the health care giant delivered stronger-than-expected first-quarter 2024 results:
→ earnings per share: actual = USD 6.91, expected = USD 6.61, last quarter = USD 6.16;
→ gross income: actual = USD 94.4