


FXOpen
The Euro and British Pound are slowly rising against the Japanese Yen. Both EUR/JPY and GBP/JPY are likely to gain further in the near term.
Important Takeaways for EUR/JPY and GBP/JPY
- The Euro climbed higher and broke the 121.50 resistance area against the Japanese Yen.
- There was a break above a major bearish trend line with resistance near 121.30 on the hourly chart of EUR/JPY.
- GBP/JPY found support near the 141.20 and it is currently rising above 142.00.
- There was a break above a key bearish trend line with resistance near 141.80 on the hourly chart.
EUR/JPY Technical Analysis
After a steady decline, the Euro found support near the 121.00 area against the Japanese Yen. The EUR/JPY pair started a decent increase and traded above the 121.50 resistance area.
Moreover, there was a break above a major bearish trend line with resistance near 121.30 on the hourly chart of EUR/JPY. The pair settled nicely above the 121.50 level and the 50 hourly simple moving average.
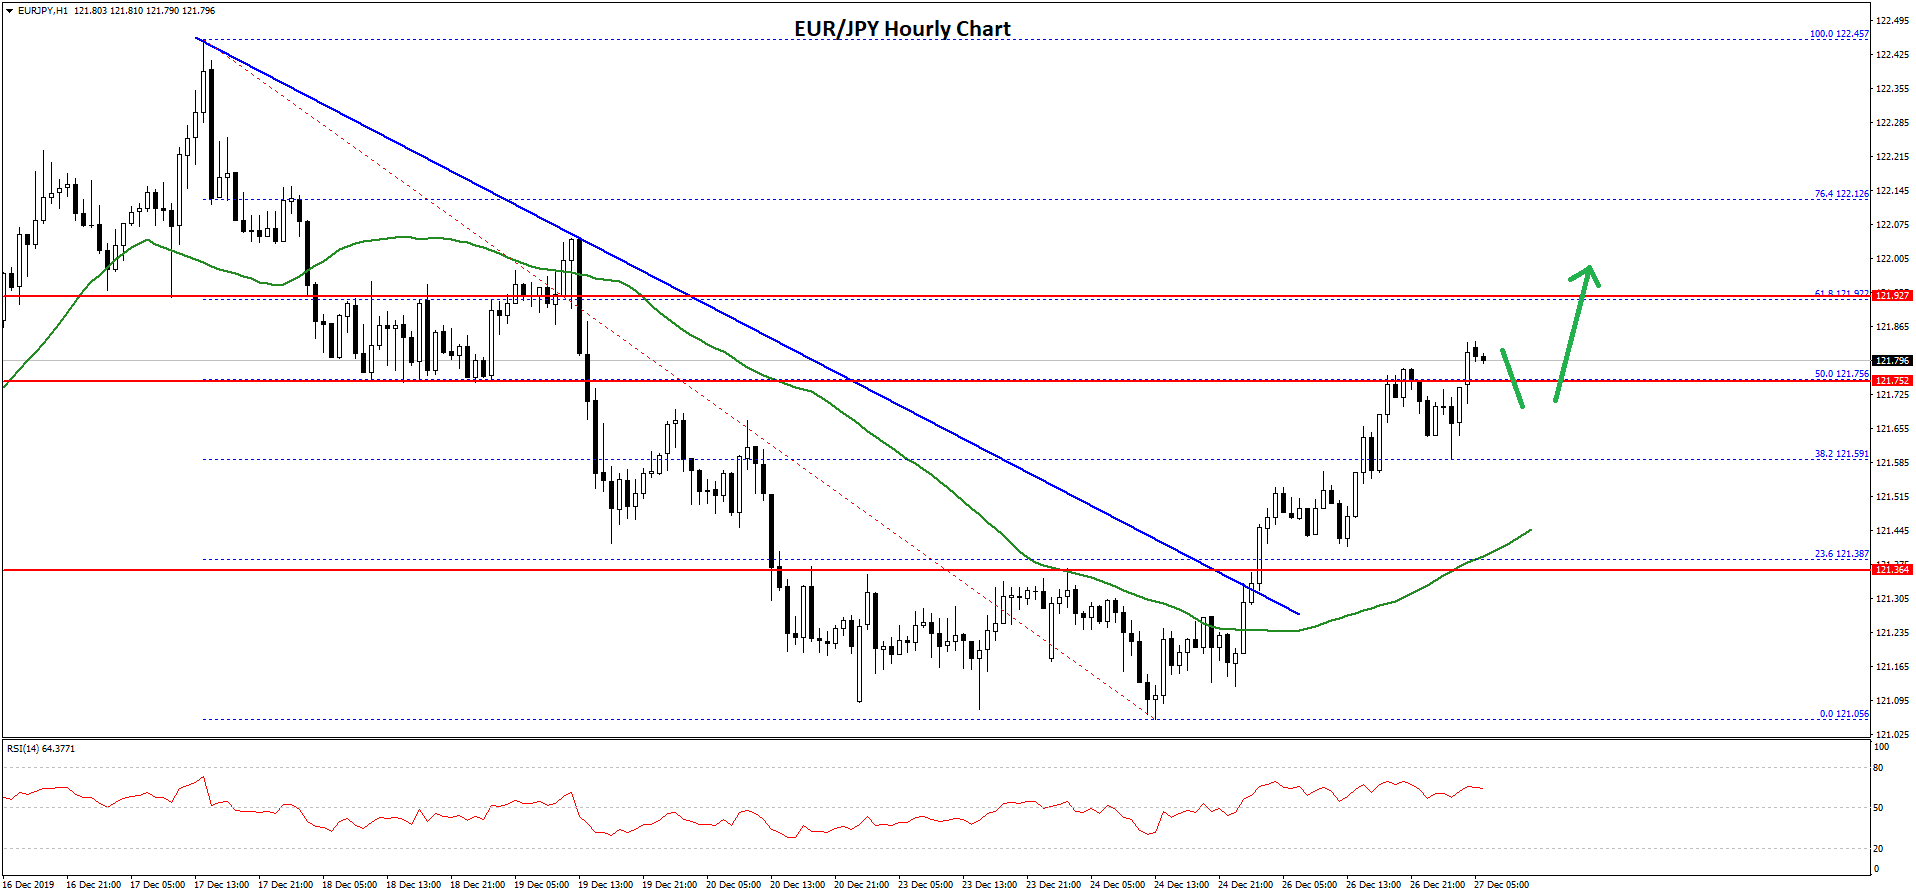
Besides, there was a break above the 50% Fib retracement level of the downward move from the 122.45 high to 121.05 low (formed on FXOpen). The pair is now trading above the 121.70 level.
An immediate resistance is seen near the 121.92 level. It represents the 61.8% Fib retracement level of the downward move from the 122.45 high to 121.05 low.
A clear break above the 121.90 and $122.00 resistance levels could start a strong rise in the near term. In the mentioned case, EUR/JPY might continue to rise towards the 122.50 resistance.
On the downside, the 121.50 level is a decent support. If the pair fails to stay above the 121.50 support, there is a risk of another decline towards the 121.00 area. An intermediate support is seen near the 121.20 level.
GBP/JPY Technical Analysis
In the past few days, the British Pound declined heavily from well above the 145.00 level against the Japanese Yen. The GBP/JPY pair broke many supports near the 144.00 and 142.00 levels.
Moreover, the price settled below the 142.00 level and the 50 hourly simple moving average. Finally, the pair found support near the 141.20 level. A swing low is formed near 141.20 and the pair is currently correcting higher.
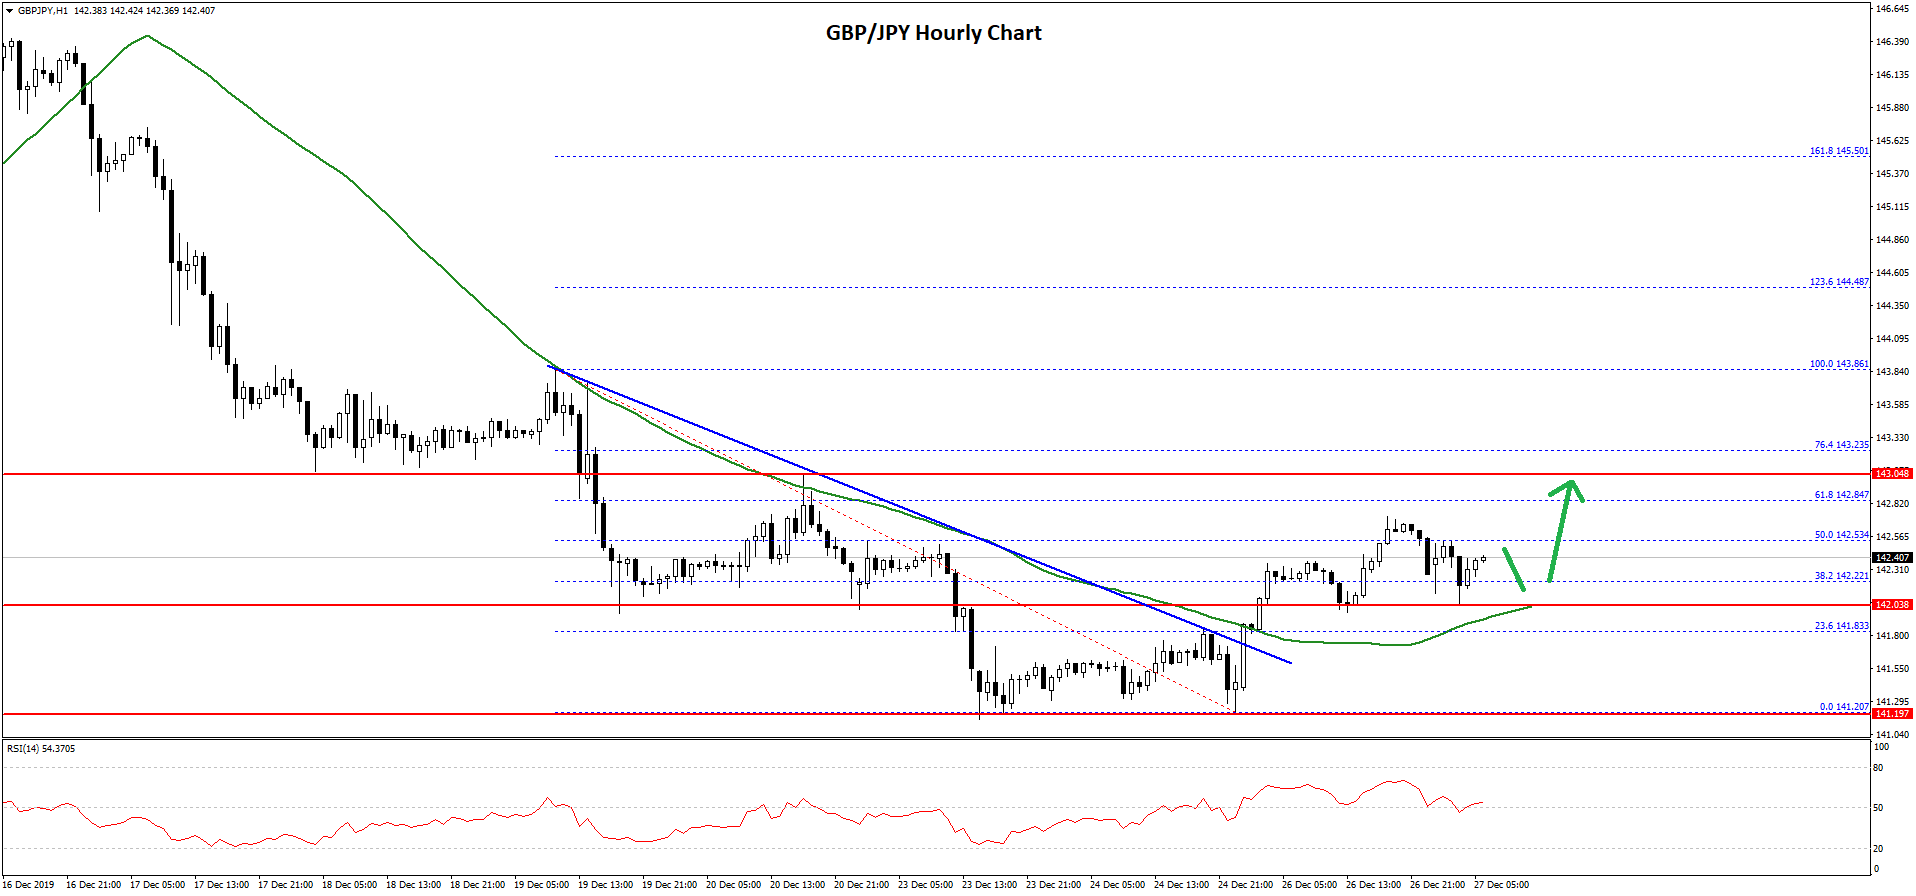
It broke the 142.00 resistance and the 50 hourly simple moving average. Besides, there was a break above the 38.2% Fib retracement level of the downward move from the 143.86 high to 141.20 low.
During the rise, there was a break above a key bearish trend line with resistance near 141.80 on the hourly chart. However, the pair seems to be struggling above the 142.50 level, plus the 50% Fib retracement level of the downward move from the 143.86 high to 141.20 low.
The pair is currently consolidating near the 142.40 level and it seems like it could rise in the near term. A clear break above the 142.80 and 143.00 resistance levels could start a decent upward move.
Conversely, the GBP/JPY pair might struggle to rise above 142.80. An initial support on the downside is near the 142.00 level. If there is a downside break below 142.00, the pair could accelerate losses towards the 141.50 and 141.20 support levels.
Trade over 50 forex markets 24 hours a day with FXOpen. Take advantage of low commissions, deep liquidity, and spreads from 0.0 pips. Open your FXOpen account now or learn more about trading forex with FXOpen.
This article represents the opinion of the Companies operating under the FXOpen brand only. It is not to be construed as an offer, solicitation, or recommendation with respect to products and services provided by the Companies operating under the FXOpen brand, nor is it to be considered financial advice.
Latest from Forex Analysis
Latest articles

What Is a Break of Structure and How Can You Trade It?
In the ever-evolving world of Smart Money Concept (SMC) trading, a nuanced understanding of market dynamics is indispensable. This article explores the concept of Break of Structure (BOS), how to identify it, and its implications for trading strategies, setting traders

Hong Kong Stocks Become Top Risers After Wild Ride Subsides
Hong Kong enjoyed a sterling reputation for an entire century as a highly polished, utterly stable mantlepiece upon which global corporations could comfortably sit and where an international talent base could reside in fabulous surroundings and approach European, American, African

Brent Oil Price Did Not Rise Despite Iran's Attack on Israel
As you know, Iran launched a missile attack on Israel over the weekend. This could greatly increase the price of Brent oil, given that Iran is one of the top 10 oil producing countries, and the fact of the strike