


FXOpen

The Euro and British Pound rallied recently and gained strength against the Japanese Yen. Both EUR/JPY and GBP/JPY are consolidating gains and likely to climb further higher.
Important Takeaways for EUR/JPY and GBP/JPY
- The Euro started a strong rise from the 107.20 support area against the Japanese Yen.
- Recently, there was a break above a short term triangle with resistance near 118.80 on the hourly chart of EUR/JPY.
- GBP/JPY surged higher and recently gained more than 200 pips to settle above 134.00.
- There is a short term contracting triangle forming with resistance near 134.45 on the hourly chart.
EUR/JPY Technical Analysis
This week, the Euro formed a solid support base near the 107.20 level against the Japanese Yen. The EUR/JPY pair started a strong rise and broke the 117.80 and 118.00 resistance levels.
During the rise, the pair broke a connecting resistance trend line at 118.10 on the hourly chart. Moreover, the pair settle above the 118.50 resistance and the 50 hourly simple moving average.
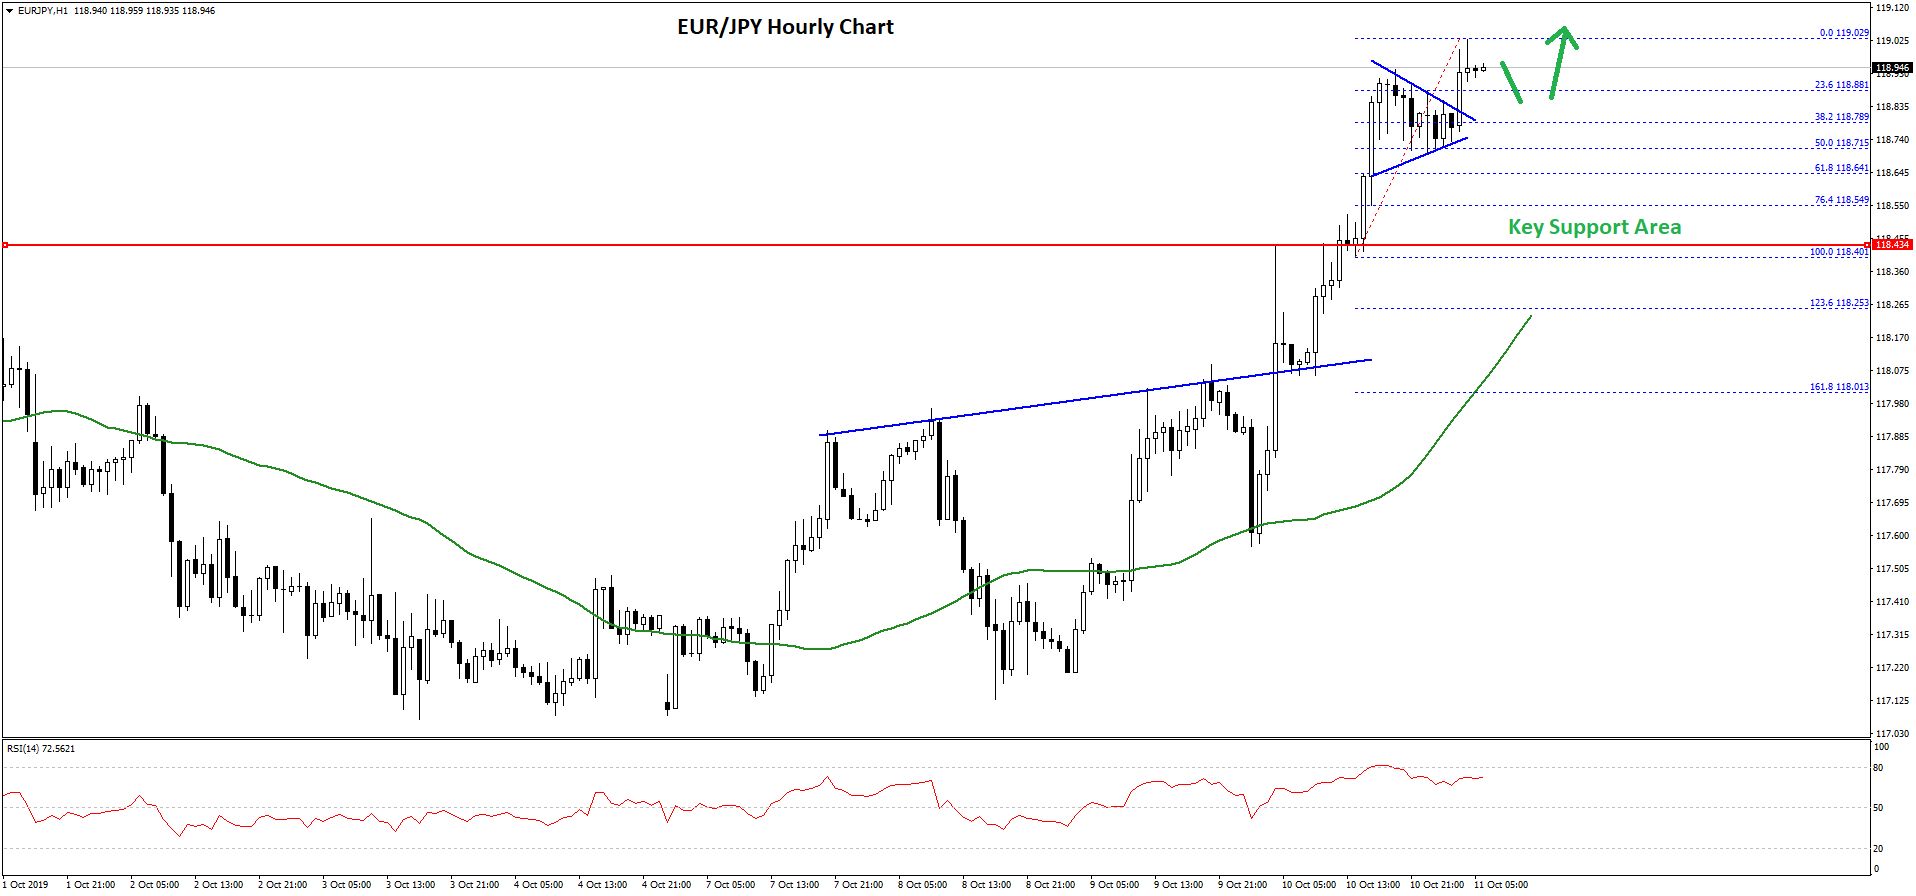
Recently, there was a break above a short term triangle with resistance near 118.80 on the same chart. Finally, the pair surpassed 119.00 and traded as high as 119.02 on FXOpen.
The pair is currently consolidating gains below the 119.00 level. An immediate support is near the 118.85 level. Moreover, it coincides with the 23.6% Fib retracement level of the recent wave from the 118.40 low to 119.02 high.
On the downside, there are many important supports near the 118.75 and 118.70 levels. Moreover, the 50% Fib retracement level of the recent wave from the 118.40 low to 119.02 high is also near the 118.70 level.
If there is a downside break below 118.70, the pair could correct lower towards the key 118.50 support area. On the upside, the 119.00 area is a major resistance. A successful break above the 119.00 resistance might open the doors for more gains towards the 119.40 and 119.50 levels.
GBP/JPY Technical Analysis
Earlier this week, the British Pound struggled to gain strength above 131.50 against the Japanese Yen. However, the GBP/JPY pair started a strong rise recently and broke many key resistances near 131.50.
There was a successful close above the 131.50 level and the 50 hourly simple moving average. Moreover, there was a break above a crucial bearish trend line with resistance near 131.50 on the hourly chart.
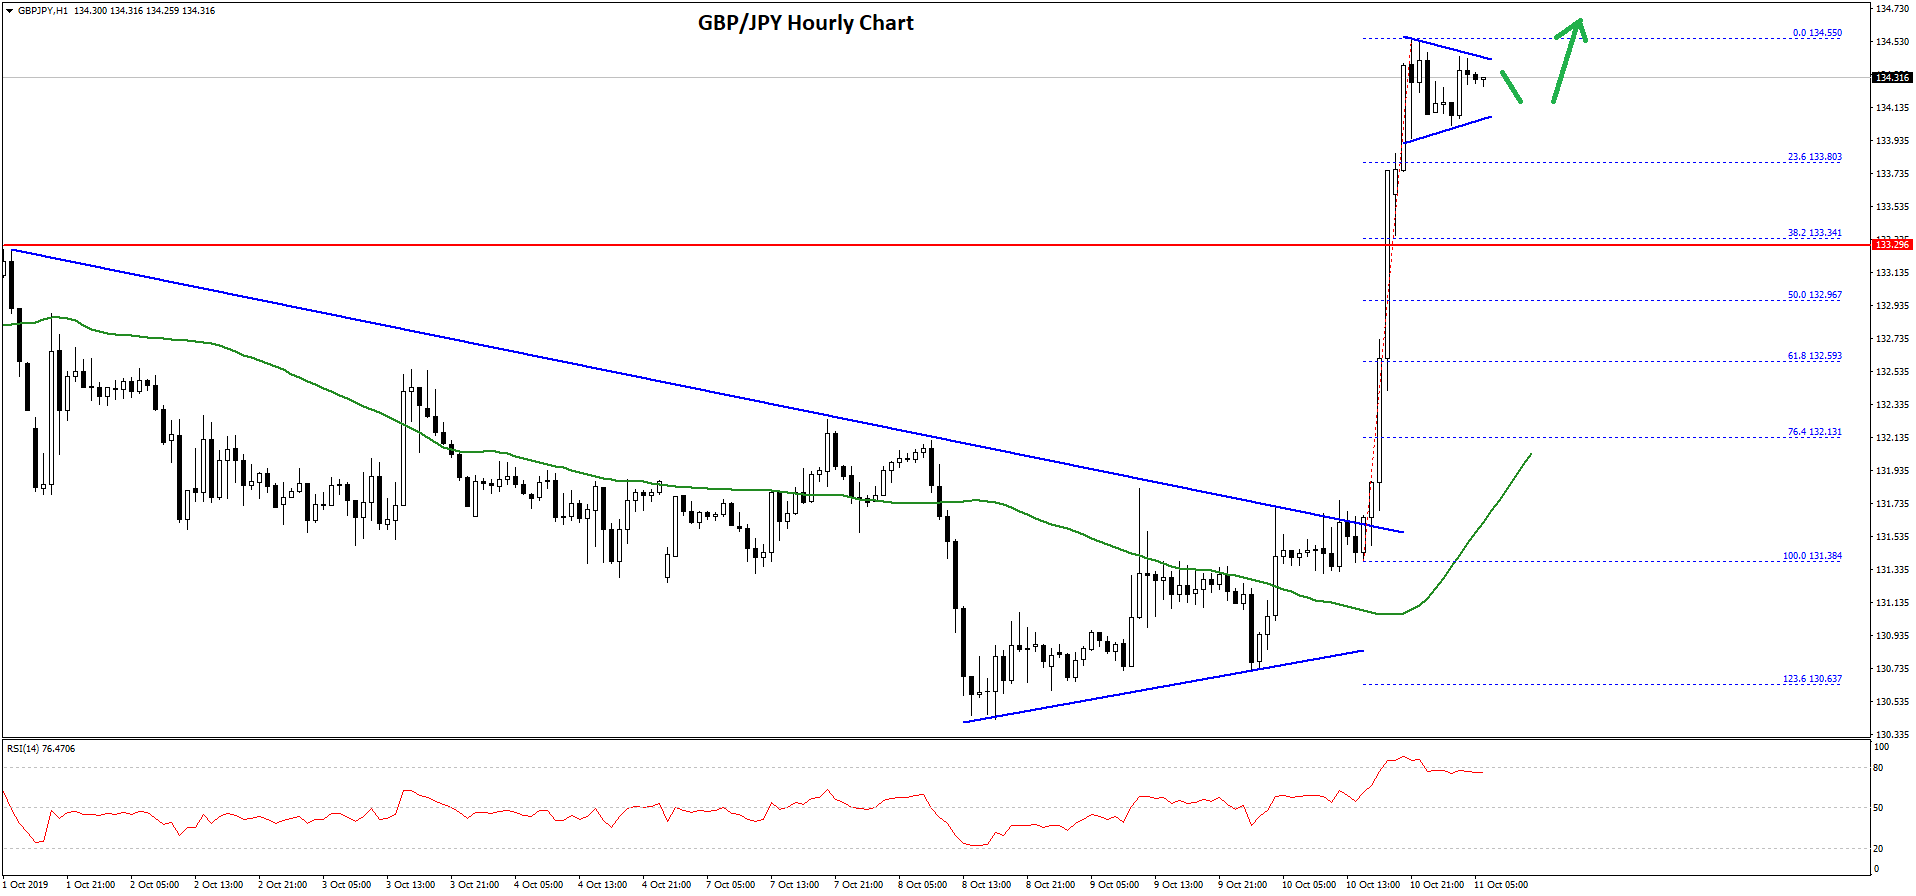
It opened the doors for more gains and the pair surged above the 132.50 and 134.00 resistance levels. It traded as high as 134.55 recently and it is currently consolidating gains.
It seems like there is a short term contracting triangle forming with resistance near 134.45 on the same chart. If there is a downside break, the pair could test the 23.6% Fib retracement level of the recent rally from the 131.38 low to 134.44 high.
However, the main support on the downside is near the 133.35 level. It coincides with the previous resistance and the 38.2% Fib retracement level of the recent rally from the 131.38 low to 134.44 high.
On the upside, the 134.50 area is a major resistance. If there is an upside break above the 134.50 resistance area, the GBP/JPY pair could continue to rise towards the 135.00 resistance area in the near term.
Trade over 50 forex markets 24 hours a day with FXOpen. Take advantage of low commissions, deep liquidity, and spreads from 0.0 pips. Open your FXOpen account now or learn more about trading forex with FXOpen.
This article represents the opinion of the Companies operating under the FXOpen brand only. It is not to be construed as an offer, solicitation, or recommendation with respect to products and services provided by the Companies operating under the FXOpen brand, nor is it to be considered financial advice.
Latest from Forex Analysis
Latest articles

Weekly Market Wrap With Gary Thomson: UK100, USD, GOLD, OIL
Get the latest scoop on the week's hottest headlines, all in one convenient video. Join Gary Thomson, the COO of FXOpen UK, as he breaks down the most significant news reports and shares his expert insights.
- UK100 Share Index Rises

What Is a Darvas Box Theory and How Does It Work in Trading?
The Darvas Box Theory, pioneered by Nicolas Darvas in the 1950s, has transcended its stock market origins to become a valuable tool for forex traders. This method leverages specific price movements and patterns, known as the Darvas Box, to track

NFLX Stock Price Falls Despite Subscriber Growth
Yesterday, after the close of the main trading session on the stock market, Netflix reported to investors for the 1st quarter of 2024.
The report turned out better than expected:
→ earnings per share: actual = USD 5.28, forecast = USD 4.