


FXOpen
EUR/USD gained bullish momentum and traded to a new multi-month high above 1.2290. EUR/JPY is also showing positive signs and trading nicely above the 126.80 support.
Important Takeaways for EUR/USD and EUR/JPY
- The Euro started a strong increase above the 1.2150 and 1.2200 resistance levels.
- There is a key bullish trend line forming with support near 1.2235 on the hourly chart of EUR/USD.
- EUR/JPY followed a similar pattern and broke the main 126.65 resistance.
- There was a break above a major bearish trend line with resistance near 126.35 on the hourly chart.
EUR/USD Technical Analysis
In the past few days, the Euro remained in a positive zone above the 1.2080 and 1.2120 levels against the US Dollar. The EUR/USD pair even broke the 1.2200 resistance zone to move further into a positive zone.
It settled nicely above the 1.2220 level and the 50 hourly simple moving average. There was an upside continuation above the 1.2250 level. The pair traded to a new multi-month high at 1.2294 on FXOpen and it is currently consolidating gains.
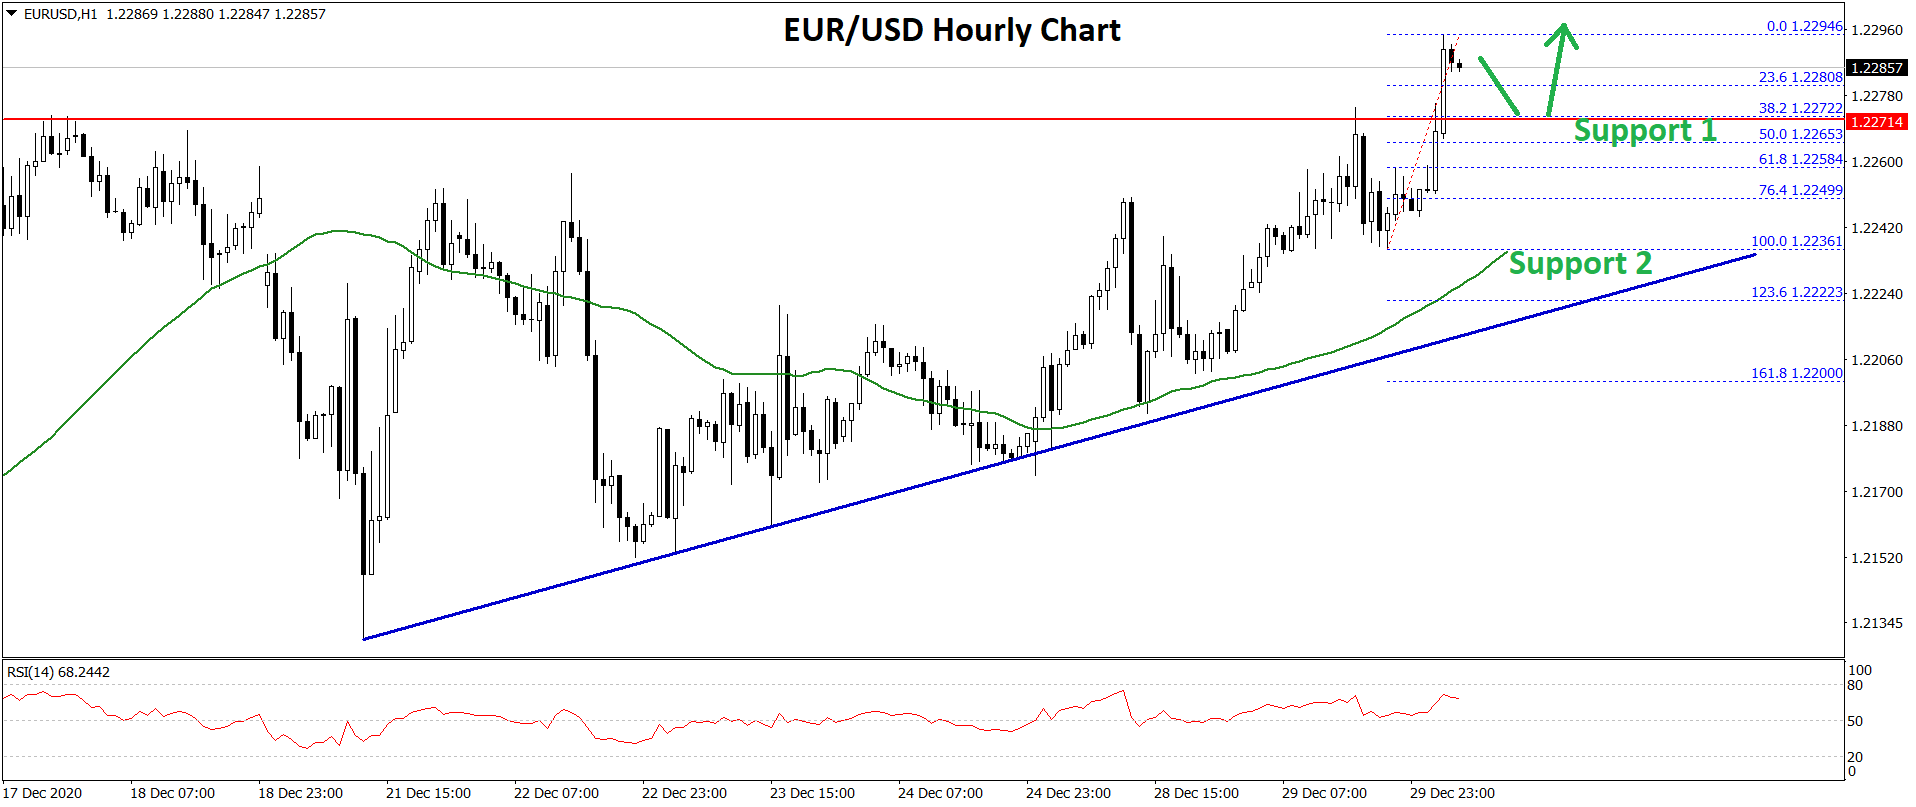
An initial support on the downside is near the 1.2280 level. It is close to the 23.6% Fib retracement level of the recent increase from the 1.2236 swing low to 1.2294 high.
The first major support is near the 1.2270 level. The next support is near the 1.2265 level or the 50% Fib retracement level of the recent increase from the 1.2236 swing low to 1.2294 high. There is also a key bullish trend line forming with support near 1.2235 on the hourly chart of EUR/USD.
Any more losses could lead the pair towards the 1.2220 level in the near term. On the upside, the 1.2300 zone is likely to act as a major resistance. A clear break above the 1.2300 zone could open the doors for a steady increase in the coming days towards 1.2340 or 1.2350.
EUR/JPY Technical Analysis
The Euro also followed a bullish path above 126.00 against the Japanese Yen. The EUR/JPY pair broke the main 126.65 resistance level to move into a positive zone.
There was also a close above the 126.80 level and the 50 hourly simple moving average. To start the current increase, there was a break above a major bearish trend line with resistance near 126.35 on the hourly chart.
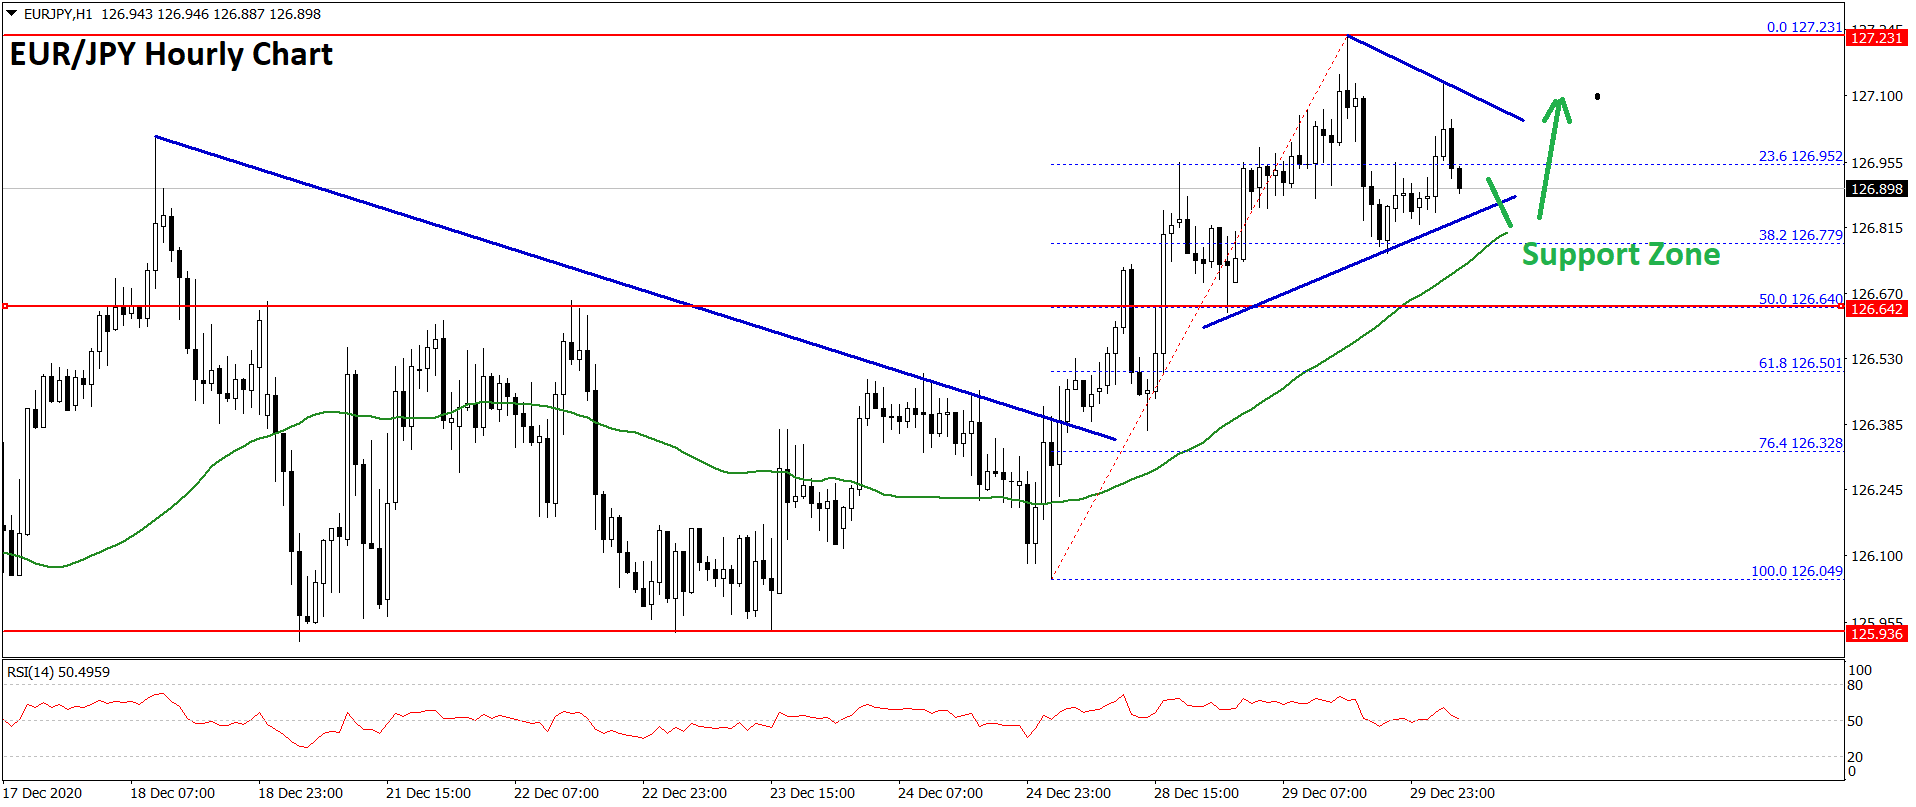
The pair traded as high as 127.23 before correcting lower. It traded below the 23.6% Fib retracement level of the recent increase from the 126.04 swing low to 127.23 high.
There is a currently a contracting triangle forming with resistance near 127.00 zone. A clear break above the 127.00 and 127.10 levels could open the doors for a sharp increase. The next major resistance for the bulls could be near the 127.50 level.
Conversely, there could be a downside break below the triangle support at 126.85. The next key support is near the 126.65 level (the breakout zone). It is close to the 50% Fib retracement level of the recent increase from the 126.04 swing low to 127.23 high.
If the pair breaks the 126.65 support zone and the 50 SMA, there are chances of a push down towards the 126.20 support zone. The next major support sits near the 126.00 zone.
Trade over 50 forex markets 24 hours a day with FXOpen. Take advantage of low commissions, deep liquidity, and spreads from 0.0 pips. Open your FXOpen account now or learn more about trading forex with FXOpen.
This article represents the opinion of the Companies operating under the FXOpen brand only. It is not to be construed as an offer, solicitation, or recommendation with respect to products and services provided by the Companies operating under the FXOpen brand, nor is it to be considered financial advice.
Latest from Forex Analysis
Latest articles

The Price of Gold XAU/USD Shows Strongest Fall in Almost 2 Years
On Monday, the price of gold fell from USD 2,386 to USD 2,333 per ounce — this is the strongest drop in one day in almost 2 years, according to Bloomberg. On Tuesday morning in the Asian session, the

Hong Kong-listed Chinese Insurer Goes on Rally as Western Giants Retract
The Asia Pacific region has once again become an area of great interest to investors and traders as some remarkable patterns of volatility have begun to make their presence felt.
This morning, a few examples of Hong Kong-listed Chinese companies

Bitcoin Price Bullish after Halving-2024
On April 19, 2024, a halving occurred in the Bitcoin network, resulting in the reward for the mined block amounting to 3.125 BTC.
Historically, after the halving (which is associated with a reduction in supply), the price of Bitcoin