


FXOpen

EUR/USD started a fresh decline after it failed to surpass 1.2000. EUR/JPY is correcting gains and it is likely to struggle near the 130.00 zone.
Important Takeaways for EUR/USD and EUR/JPY
- The Euro topped near the 1.2000 level and started a fresh decline.
- There is a key declining channel forming with resistance near 1.1930 on the hourly chart of EUR/USD.
- EUR/JPY tested the 130.50 and recently declined to test the 129.50 support.
- There is a major bullish trend line forming with support near 129.65 on the hourly chart.
EUR/USD Technical Analysis
Recently, the Euro made an attempt to climb above the 1.2000 resistance against the US Dollar, but it failed. The EUR/USD pair started a fresh decline and broke the 1.1960 support zone.
The pair even broke the 1.1945 support level and the 50 hourly simple moving average. It traded as low as 1.1882 on FXOpen before the pair started consolidating losses. It climbed above 1.1900, but there was no bullish momentum.
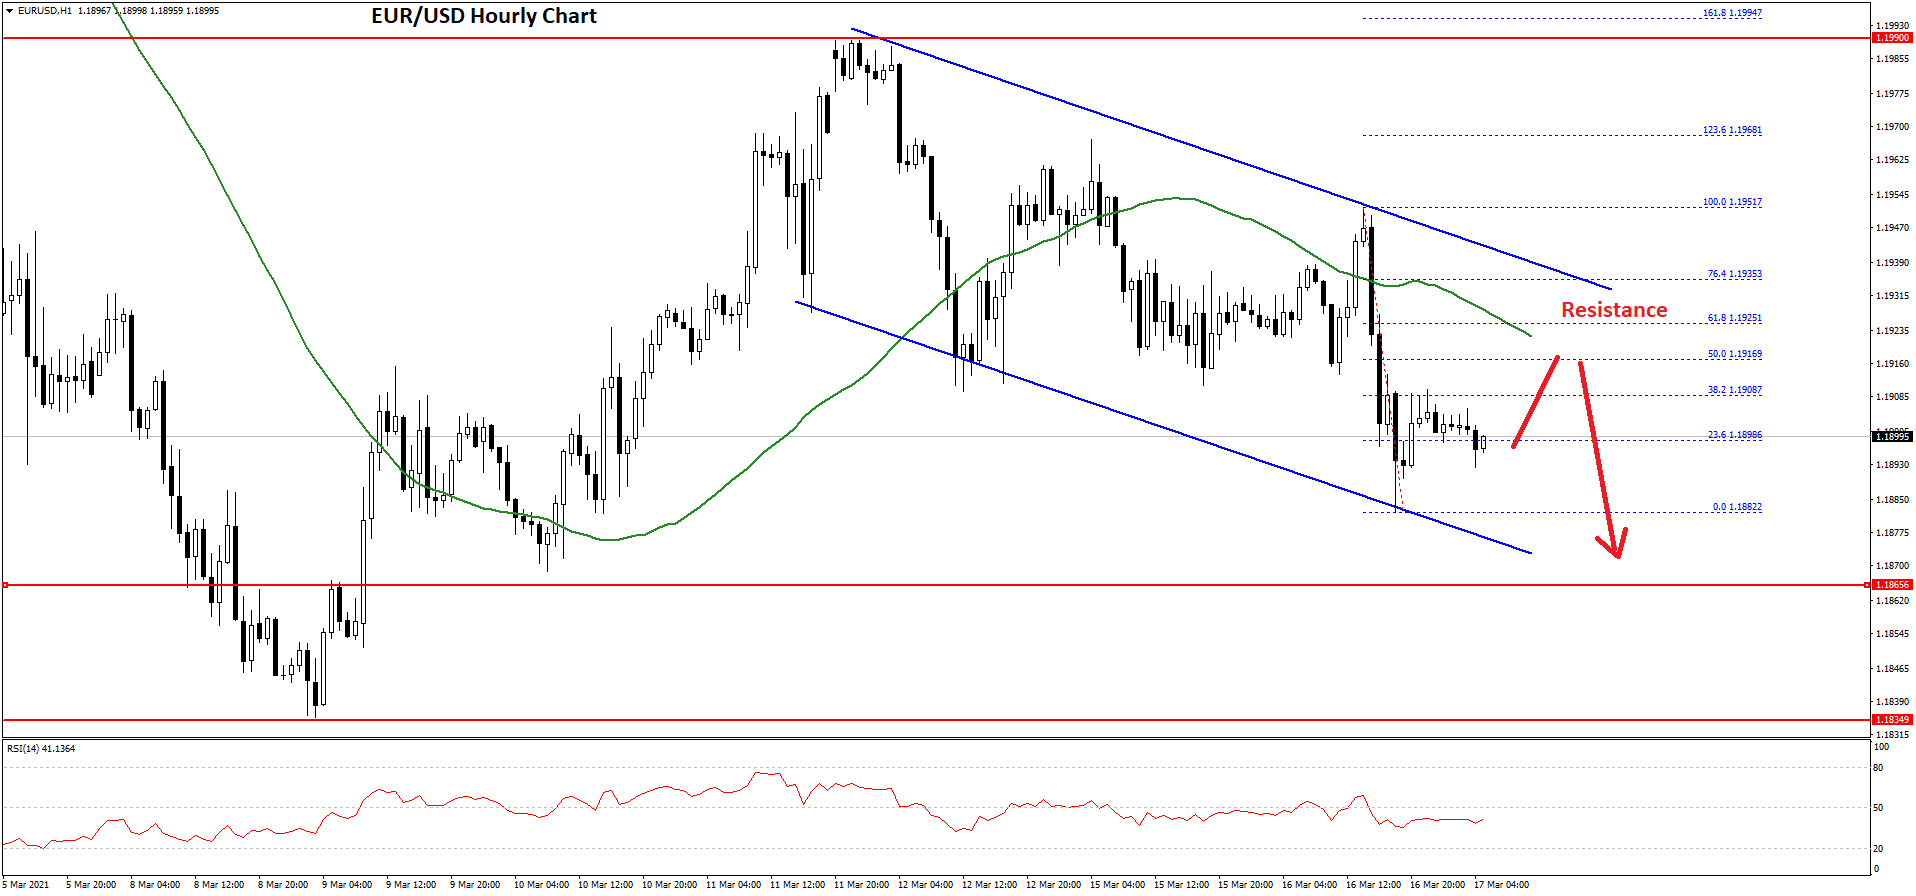
An initial resistance is near the 1.1915 level. It is close to the 50% Fib retracement level of the recent decline from the 1.1951 high to 1.1882 low. The next major resistance is near the 1.1925 level and the 50 hourly simple moving average.
There is also a key declining channel forming with resistance near 1.1930 on the hourly chart of EUR/USD. The channel resistance is near the 61.8% Fib retracement level of the recent decline from the 1.1951 high to 1.1882 low.
Therefore, the pair is likely to face a strong resistance near the 1.1925 and 1.1930 levels. A clear break above 1.1930 might start a fresh increase towards the 1.2000 resistance.
If not, there are chances of more losses in EUR/USD below the 1.1880 support zone. The next major support is near the 1.1850 level, below which the pair could dive towards the 1.1800 support level.
EUR/JPY Technical Analysis
The Euro followed a decent bullish path above the 128.00 resistance zone against the Japanese Yen. The EUR/JPY pair broke the 129.50 resistance level to move into a positive zone.
It even cleared the 130.00 resistance and settled nicely above the 50 hourly simple moving average. It traded to a new monthly high at 130.48 before correcting lower. The recent swing high was formed near 130.39 before the pair dipped below 130.00.
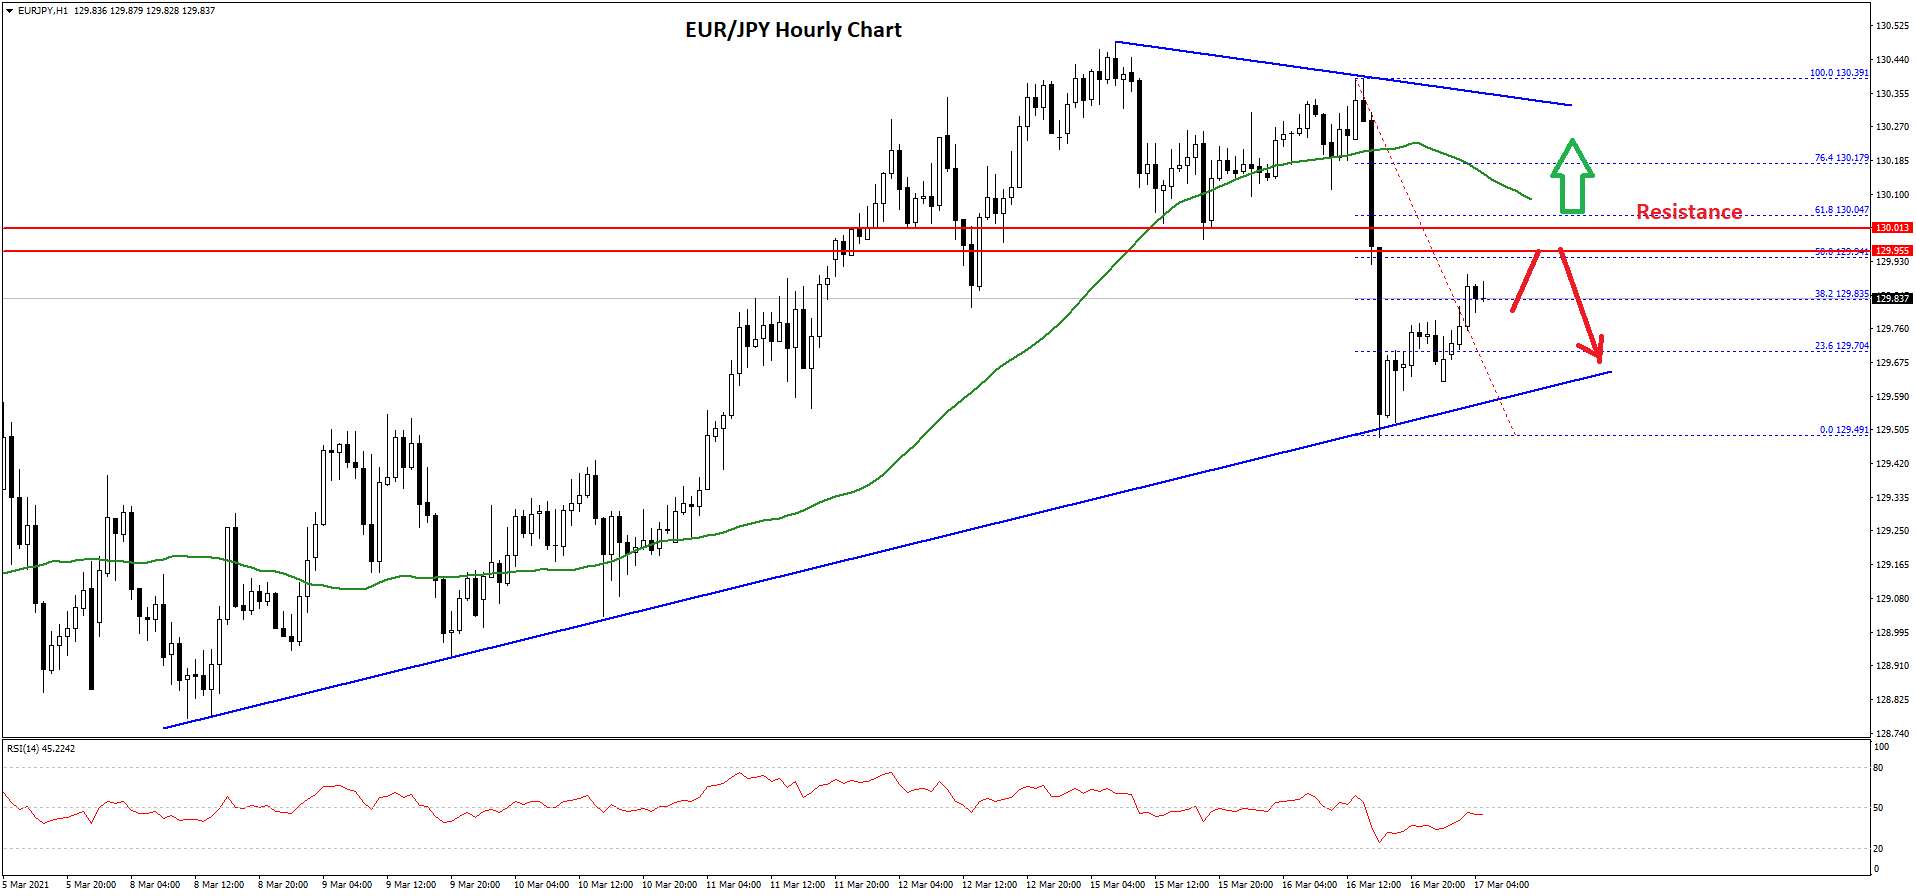
It traded as low as 129.49 and settled below the 50 hourly simple moving average. The pair is now correcting higher and trading above 129.70.
There was a break above the 23.6% Fib retracement level of the downward move from the 130.39 swing high to 129.49 low. On the upside, there is a key resistance forming near the 129.95 and 130.00 levels.
The 50% Fib retracement level of the downward move from the 130.39 swing high to 129.49 low is also near the 130.00 level. A clear close above the 130.00 level and a follow up move above the 50 hourly simple moving average could open the doors for a steady increase.
Conversely, the pair could fail to clear 130.00. On the downside, there is a key support forming near 129.70. There is also a major bullish trend line forming with support near 129.65 on the hourly chart. If there is a downside break, the pair could dive towards 129.00.
Trade over 50 forex markets 24 hours a day with FXOpen. Take advantage of low commissions, deep liquidity, and spreads from 0.0 pips. Open your FXOpen account now or learn more about trading forex with FXOpen.
This article represents the opinion of the Companies operating under the FXOpen brand only. It is not to be construed as an offer, solicitation, or recommendation with respect to products and services provided by the Companies operating under the FXOpen brand, nor is it to be considered financial advice.
Latest from Forex Analysis
Latest articles

What Order Imbalance Is and How To Use It in a Trading Strategy
Understanding the nuances of order imbalances is key for traders looking to navigate the ebb and flow of asset prices. Order imbalances provide a clear window into the supply and demand dynamics at play, offering strategic insights. This article delves

XAU/USD Gold Price Reaches an Important Resistance Zone
The XAU/USD gold chart today indicates that the historical record price of the metal is above USD 2,400 per ounce.
In addition to fears of a new round of inflation due to rising commodity prices, geopolitical tensions are

What Is a Break of Structure and How Can You Trade It?
In the ever-evolving world of Smart Money Concept (SMC) trading, a nuanced understanding of market dynamics is indispensable. This article explores the concept of Break of Structure (BOS), how to identify it, and its implications for trading strategies, setting traders