


FXOpen

EUR/USD is rising steadily and trading nicely above the 1.1180 level. EUR/JPY is also gaining bullish momentum and it is likely to continue higher above 121.80.
Important Takeaways for EUR/USD and EUR/JPY
- The Euro is trading in a positive zone above the 1.1100 and 1.1150 resistance levels.
- There is a major bullish trend line forming with support near 1.1140 on the hourly chart of EUR/USD.
- EUR/JPY surged higher and broke many key hurdles near the 121.00 resistance.
- There is a key bullish trend line forming with support near 120.60 on the hourly chart.
EUR/USD Technical Analysis
After forming a strong support above 1.0900, the Euro started a strong increase against the US Dollar. The EUR/USD pair broke many hurdles near 1.1100 to move into a positive zone.
There was a close above the 1.1120 level and the 50 hourly simple moving average. The pair recently tested the 1.1200 zone and traded as high as 1.1201 on FXOpen. The current price action is positive and dips remain supported near 1.1180.
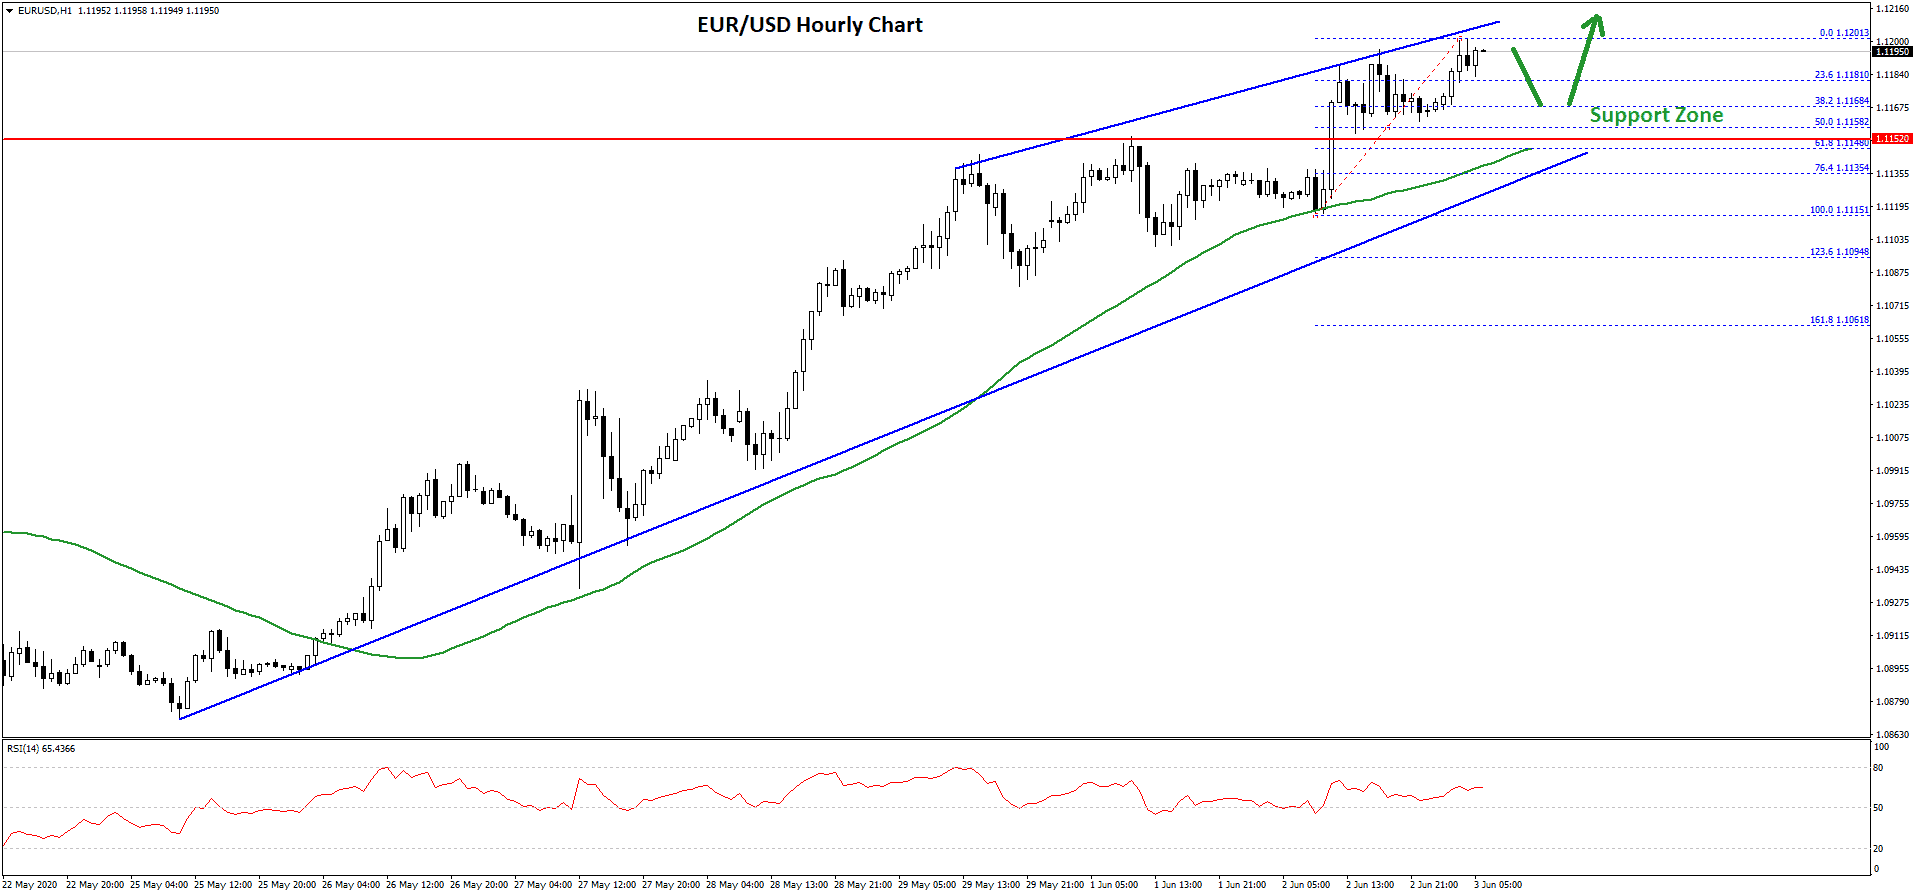
The 23.6% Fib retracement level of the recent rally from the 1.1115 low to 1.1201 high is also near the 1.1180 level to act as a support. There is also a major bullish trend line forming with support near 1.1140 on the hourly chart of EUR/USD.
The trend line is close to the 1.1150 pivot level. The 50% Fib retracement level of the recent rally from the 1.1115 low to 1.1201 high could also provide support near the 1.1150 level and the 50 hourly simple moving average.
If the pair fails to stay above 1.1150 and 1.1140, it could revisit the 1.1100 support zone. On the upside, the pair is likely to continue higher above the 1.1200 resistance zone.
A successful close above the 1.1200 resistance could lift the pair towards the 1.1240 and 1.1250 levels. Any further gains may perhaps call for a test of the 1.1320 level in the near term.
EUR/JPY Technical Analysis
The Euro followed a strong bullish path above the 118.80 level against the Japanese Yen. The EUR/JPY pair broke many hurdles near 120.00 and 120.50 to move into a positive zone.
Besides, there was a close above the 121.00 level and the 50 hourly simple moving average. The pair traded as high as 121.80 and recently corrected a few points.
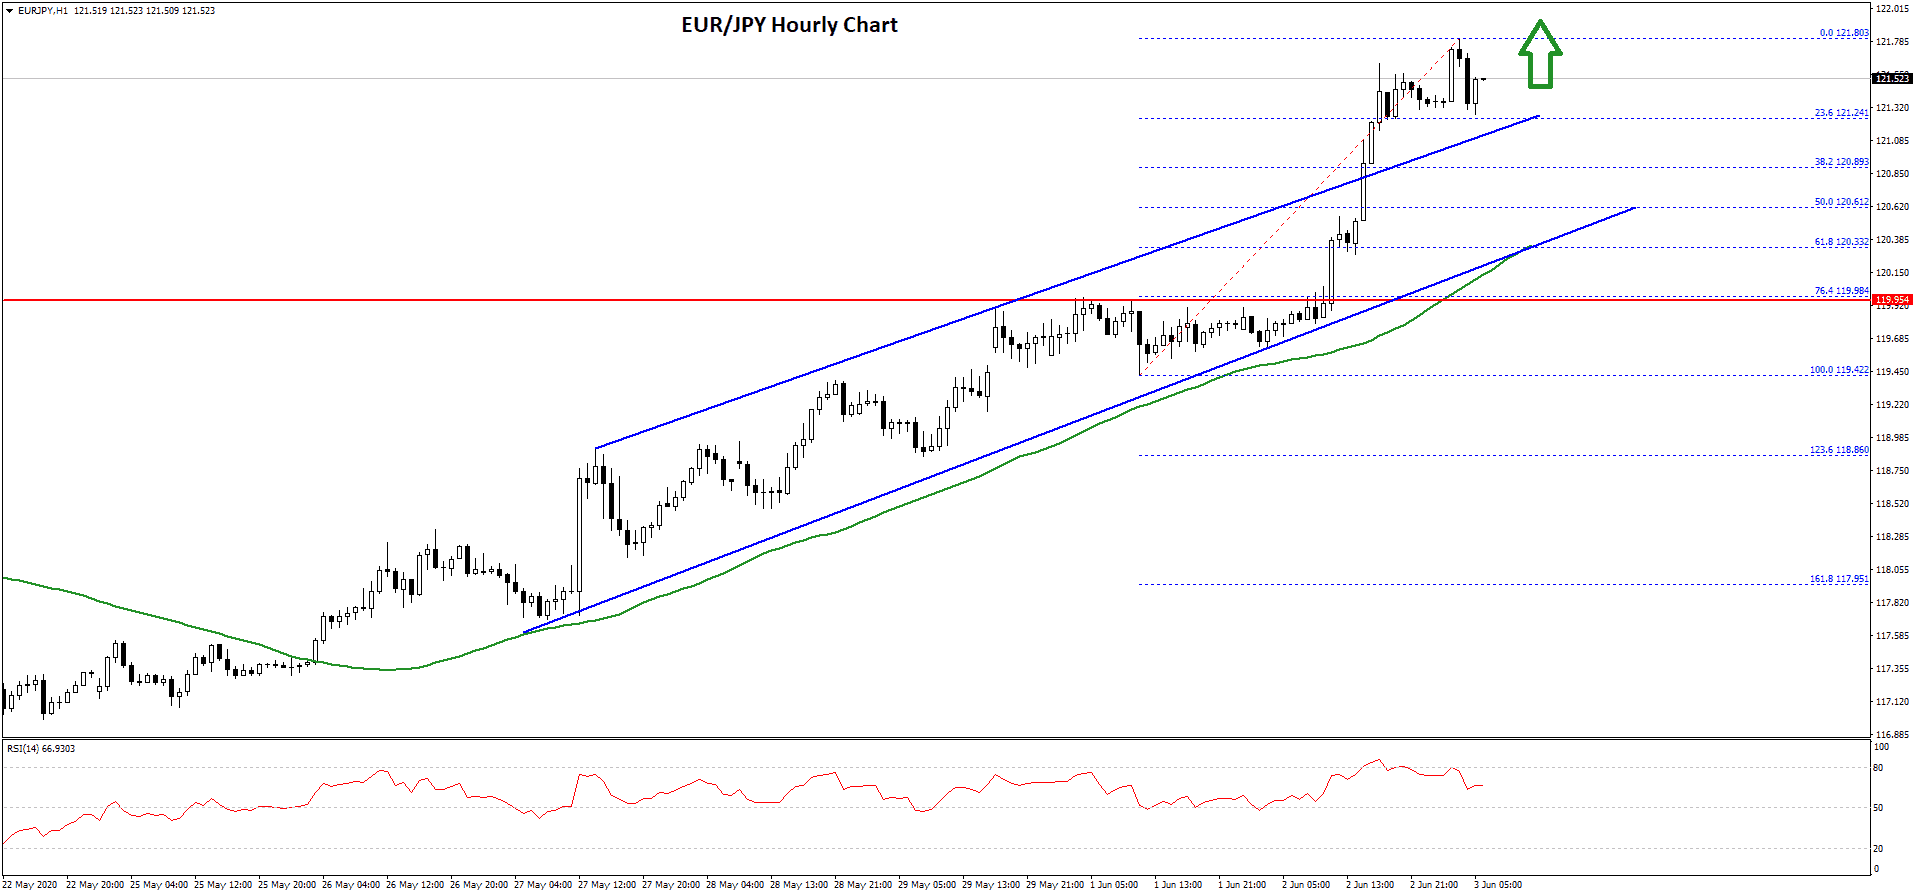
There was a break below the 121.50 level. However, the pair remained well bid above the 23.6% Fib retracement level of the recent wave from the 119.42 low to 121.80 high.
On the downside, the first major support is seen near the 120.50 zone. The 50% Fib retracement level of the recent wave from the 119.42 low to 121.80 high is also near the 120.60 level.
Moreover, there is a key bullish trend line forming with support near 120.60 on the hourly chart. If the pair fails to stay above the trend line support, there is a risk of a larger decline below the 120.00 support in the coming sessions. The next major support is near the 118.80 level.
Conversely, EUR/JPY might continue to rise above the 121.80 and 122.00 levels. The next major resistance is near the 122.40 level, above which the bulls are likely to aim 123.50.
Trade over 50 forex markets 24 hours a day with FXOpen. Take advantage of low commissions, deep liquidity, and spreads from 0.0 pips. Open your FXOpen account now or learn more about trading forex with FXOpen.
This article represents the opinion of the Companies operating under the FXOpen brand only. It is not to be construed as an offer, solicitation, or recommendation with respect to products and services provided by the Companies operating under the FXOpen brand, nor is it to be considered financial advice.
Latest from Forex Analysis
Latest articles

Since the Start of the Week, Brent Oil Price Has Dropped over 4%
At the beginning of the week, March 15, we wrote that the price of Brent oil could form a correction from the resistance level of USD 91 per barrel. Since then, the price has decreased by more than 4% due

Fair Value Gaps vs Liquidity Voids in Trading
Understanding fair value gaps and liquidity voids is essential for traders seeking to navigate the complexities of the financial markets. These concepts, deeply rooted in the Smart Money Concept (SMC), provide valuable insights into the dynamics of supply and demand,

UK100 Share Index Rises as UK Inflation Slows
Yesterday, the UK Office for National Statistics (ONS) reported that the CPI stood at 3.2% in March. According to ForexFactory, analysts expected 3.1%, and a month ago the index was 3.4%.
Grant Fitzner, chief economist at the