


FXOpen
EUR/USD started a major downside move and traded below the 1.1430 support level. USD/CHF is trading nicely above the 0.9980 support and it could trade further higher.
Important Takeaways for EUR/USD and USD/CHF
- The Euro faced an increased selling pressure and declined below the 1.1420 support against the US Dollar.
- There is a major bearish trend line formed with resistance near 1.1415 on the hourly chart of EUR/USD.
- USD/CHF climbed higher and broke the 1.0000 resistance level.
- There is a major bullish trend line formed with support at 0.9980 on the hourly chart.
EUR/USD Technical Analysis
The Euro failed to hold gains above the 1.1500 level and started a downside move against the US Dollar. The EUR/USD pair broke the 1.1450 and 1.1420 support levels to enter a bearish zone.
It seems like the trimmed most of its gains after it formed a high at 1.1513 on FXOpen. It even settled below the 1.1420 support level and the 50 hourly simple moving average. During the drop, there was a break below the 76.4% Fib retracement level of the last wave from the 1.1389 low to 1.1513 high.
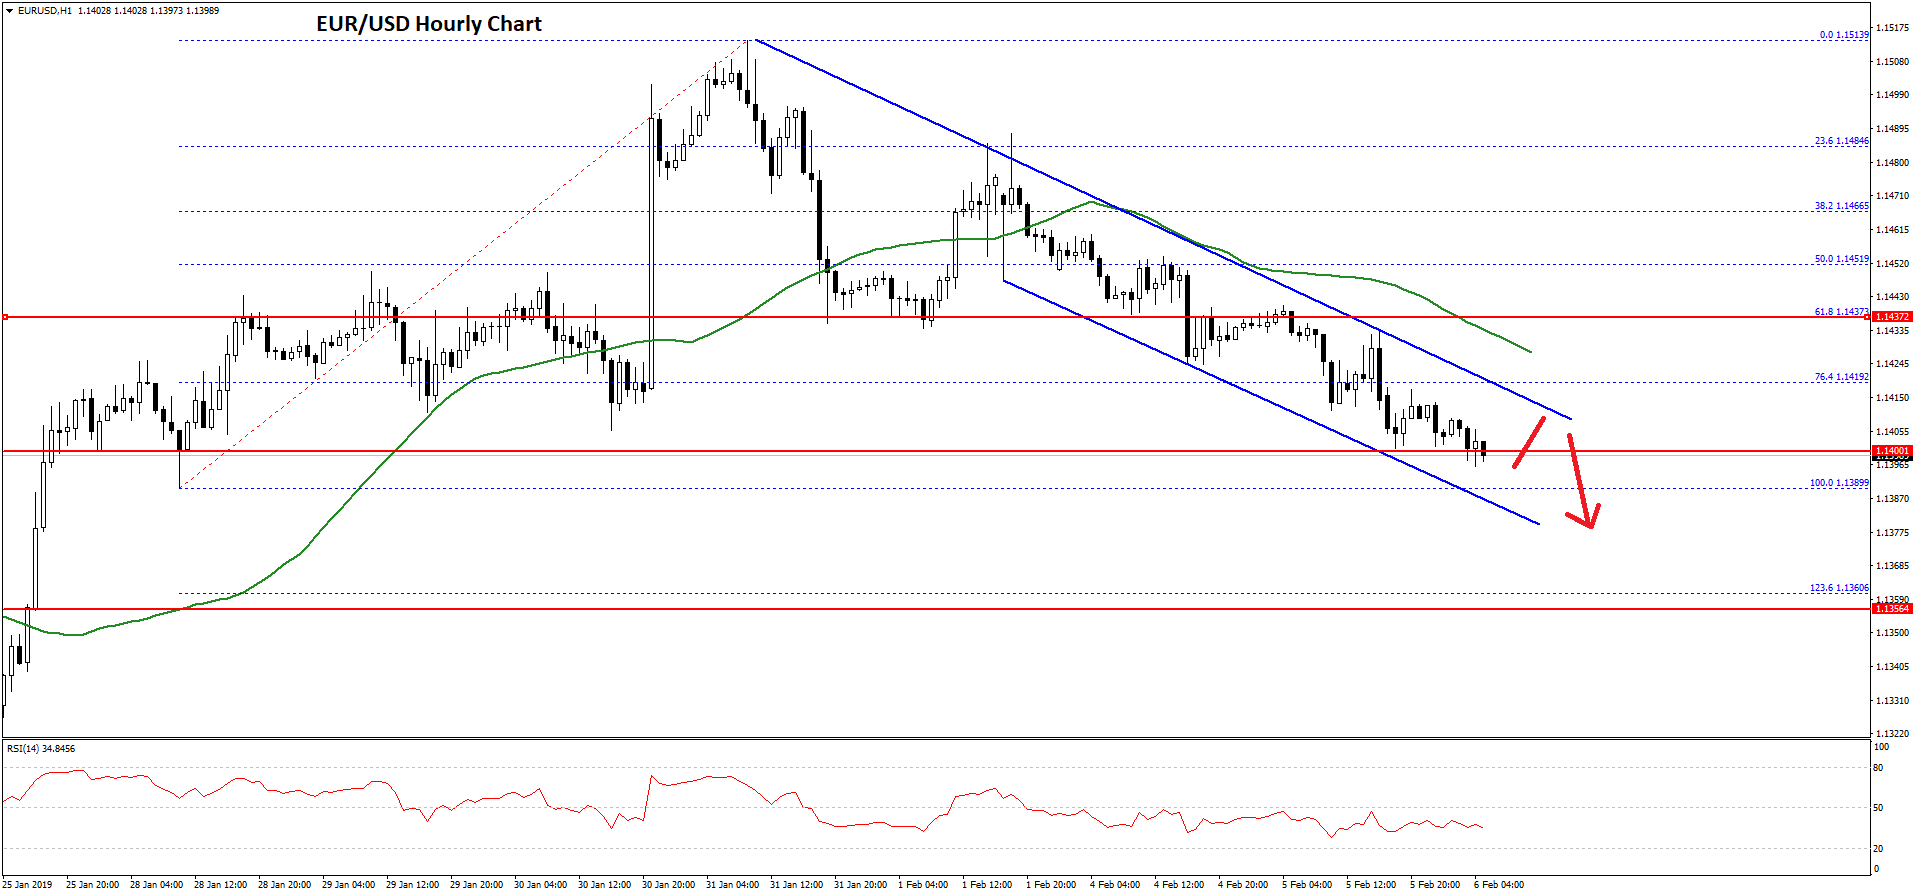
Therefore, there are chances of more losses below the 1.1389 low. The next stop for sellers could be near the 1.1360 support and the 1.236 Fib extension level of the last wave from the 1.1389 low to 1.1513 high.
On the upside, there are many resistance near the 1.1415 and 1.1420 levels. The previous support at 1.1420 is likely to act as a strong resistance in the near term.
There is also a major bearish trend line formed with resistance near 1.1415 on the hourly chart of EUR/USD. A break above the channel resistance could push the pair towards 1.1430 and the 50 hourly simple moving average.
To start a fresh upward move, the pair needs to break the 1.1420 and 1.1430 resistance levels. However, the main resistance is near the 1.1435-1.1440 zone in the near term.
USD/CHF Technical Analysis
The US Dollar formed a solid support near the 0.9910 level and started a strong upward move against the Swiss franc. The USD/CHF pair traded above the 0.9940 and 0.9950 resistance levels to start an uptrend.
Buyers gained momentum and broke the 0.9980 and 1.0000 resistance levels. A high was formed at 1.0020 before the pair started a downside correction. It declined below the 23.6% Fib retracement level of the last wave from the 0.9922 low to 1.0020 high.
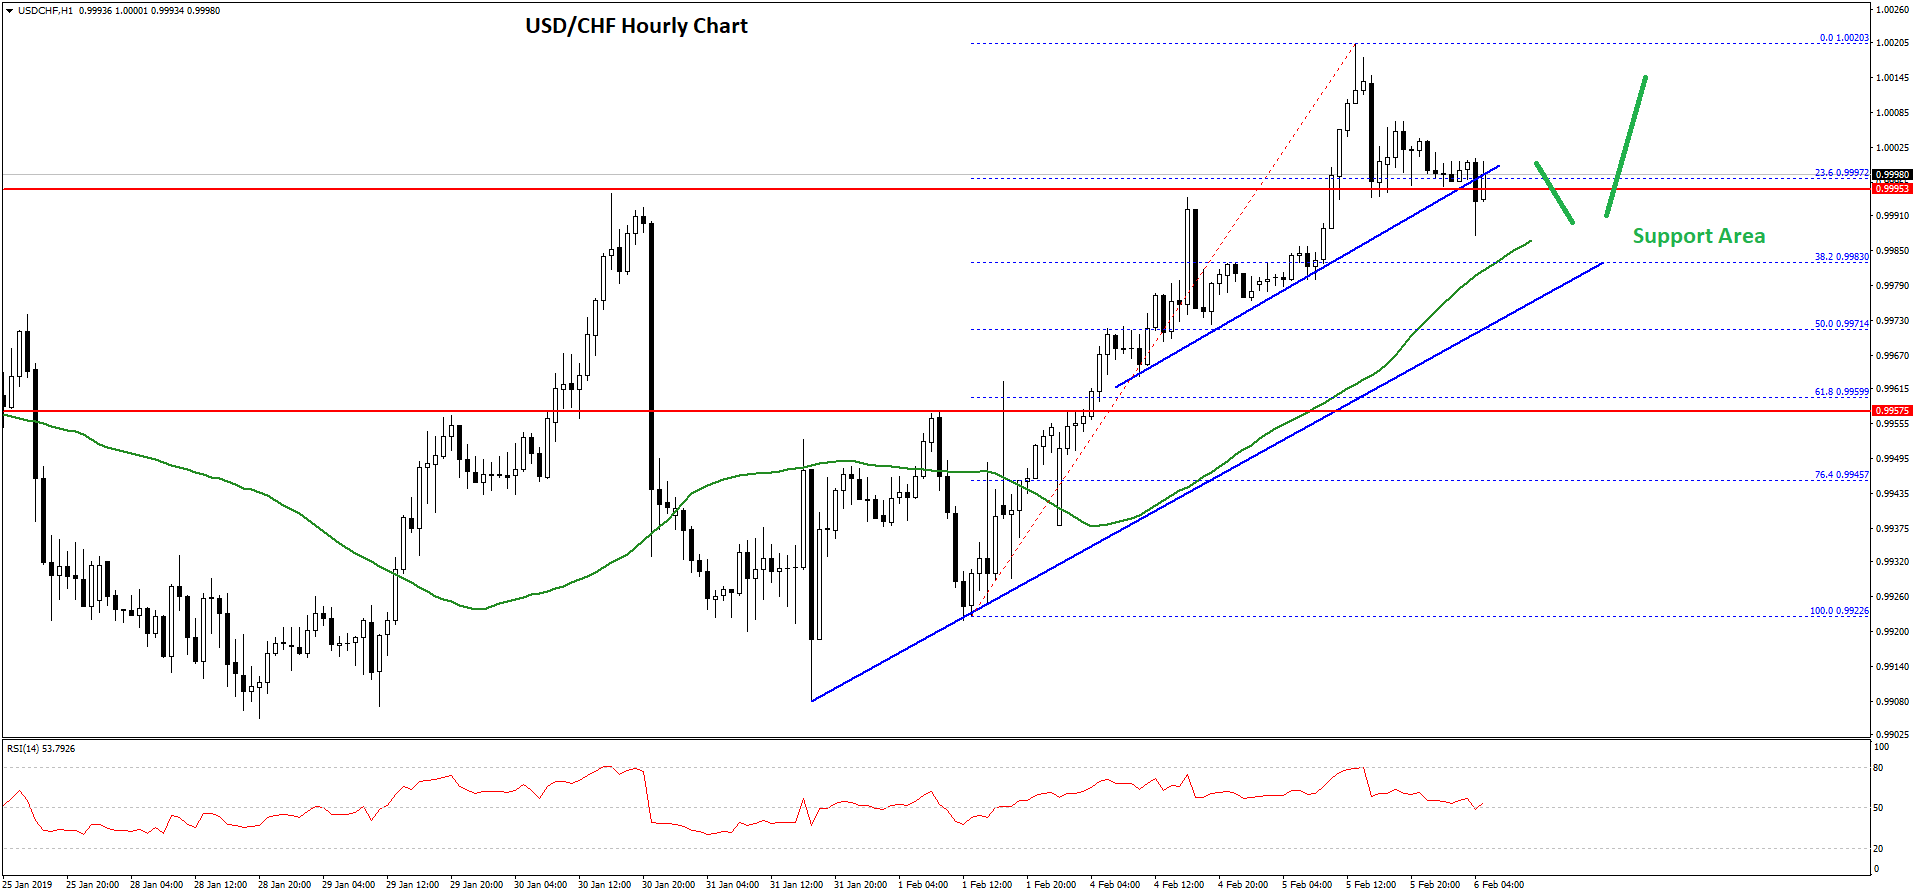
However, there is a strong support formed near the 0.9980 level and the 50 hourly simple moving average. Moreover, there is a major bullish trend line formed with support at 0.9980 on the hourly chart.
Therefore, if the pair corrects lower, it is likely to find a strong buying interest near 0.9980 and the 50 hourly simple moving average, below which the next support is at 0.9950.
On the upside, an initial resistance is near the 1.0015 and 1.0020 levels. If there is an upside break above 1.0020, the USD/CHF pair could trade towards the 1.0050 level in the near term.
Overall, the price action is positive and it seems like the US Dollar buyers are in control versus the Euro and the Swiss Franc.
Trade over 50 forex markets 24 hours a day with FXOpen. Take advantage of low commissions, deep liquidity, and spreads from 0.0 pips. Open your FXOpen account now or learn more about trading forex with FXOpen.
This article represents the opinion of the Companies operating under the FXOpen brand only. It is not to be construed as an offer, solicitation, or recommendation with respect to products and services provided by the Companies operating under the FXOpen brand, nor is it to be considered financial advice.
Latest from Forex Analysis
Latest articles

Weekly Market Wrap With Gary Thomson: UK100, USD, GOLD, OIL
Get the latest scoop on the week's hottest headlines, all in one convenient video. Join Gary Thomson, the COO of FXOpen UK, as he breaks down the most significant news reports and shares his expert insights.
- UK100 Share Index Rises

What Is a Darvas Box Theory and How Does It Work in Trading?
The Darvas Box Theory, pioneered by Nicolas Darvas in the 1950s, has transcended its stock market origins to become a valuable tool for forex traders. This method leverages specific price movements and patterns, known as the Darvas Box, to track

NFLX Stock Price Falls Despite Subscriber Growth
Yesterday, after the close of the main trading session on the stock market, Netflix reported to investors for the 1st quarter of 2024.
The report turned out better than expected:
→ earnings per share: actual = USD 5.28, forecast = USD 4.