


FXOpen
EUR/USD is trading nicely above the 1.1280 support and it could continue to move higher. USD/CHF is currently correcting lower, but it remains supported on dips near 1.0050.
Important Takeaways for EUR/USD and USD/CHF
- The Euro traded higher recently and tested the 1.1320 resistance area against the US Dollar.
- There is a major contracting triangle in place with resistance near 1.1305 on the hourly chart of EUR/USD.
- USD/CHF climbed higher recently above the 1.0000 and 1.0050 resistance levels.
- There is a crucial bullish trend line formed with support at 1.0050 on the hourly chart.
EUR/USD Technical Analysis
The Euro started a solid rebound after forming a support base above the 1.1200 and 1.1220 levels against the US Dollar. The EUR/USD pair climbed above the 1.1250 and 1.1280 resistance levels to move into a positive zone.
The pair even broke the 1.1300 resistance area and formed a high near the 1.1323 level on FXOpen. Later, the pair started a downside correction below the 1.1300 level and the 50 hourly simple moving average.
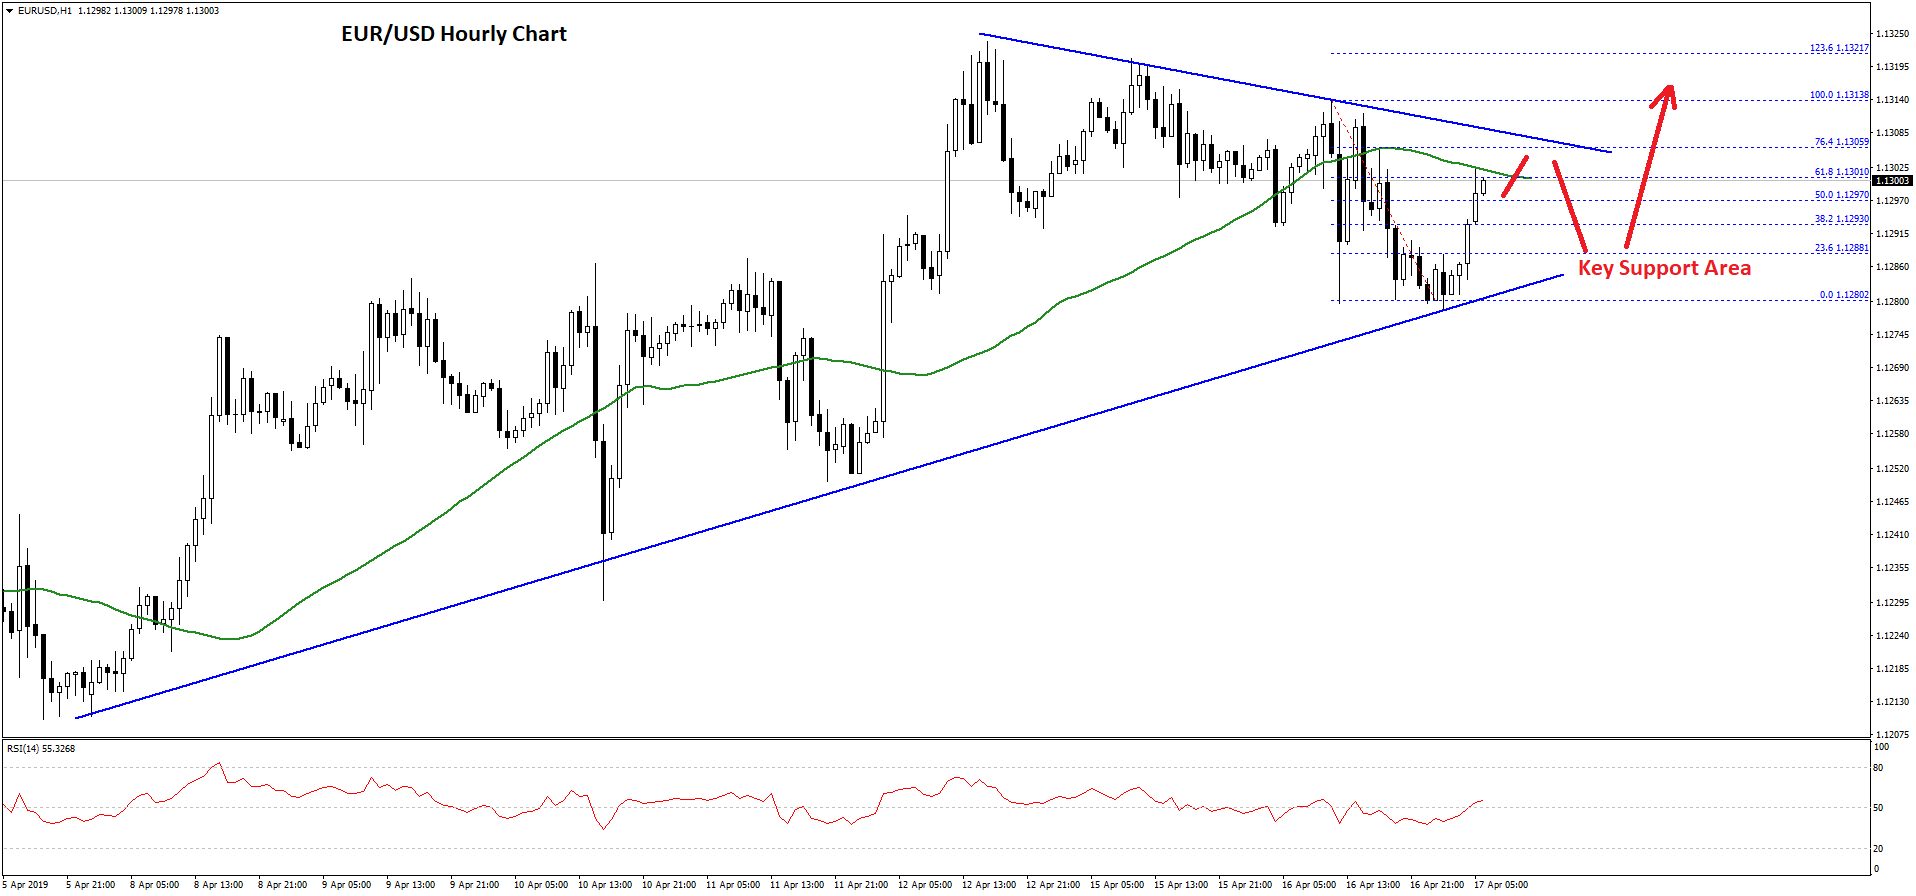
The last swing low was formed near 1.1280 and the pair is currently moving higher. It broke the 50% Fib retracement level of the recent decline from the 1.1313 high to 1.1280 low.
However, the pair is facing a tough resistance near the 1.1300 level and the 50 hourly simple moving average. Besides, the 61.8% Fib retracement level of the recent decline from the 1.1313 high to 1.1280 low is acting as a resistance.
More importantly, there is a major contracting triangle in place with resistance near 1.1305 on the hourly chart of EUR/USD. The pair could continue to trade in a range for some time before it could make an attempt to clear the 1.1300 and 1.1305 resistance levels.
If there is an upside break, the pair could trade towards 1.1320 and 1.1340. On the other hand, if there is a downside break, the pair could decline sharply towards the 1.1250 and 1.1225 support levels.
USD/CHF Technical Analysis
The US Dollar started a strong uptrend from the 0.9980 support level against the Swiss franc. The USD/CHF pair traded above the 1.0000 and 1.0050 resistance levels to move into a positive zone.
The recent upward move was convincing since there was a close above the 1.0050 level and the 50 hourly simple moving average. The pair traded close the 1.0100 resistance and formed a high at 1.0082.
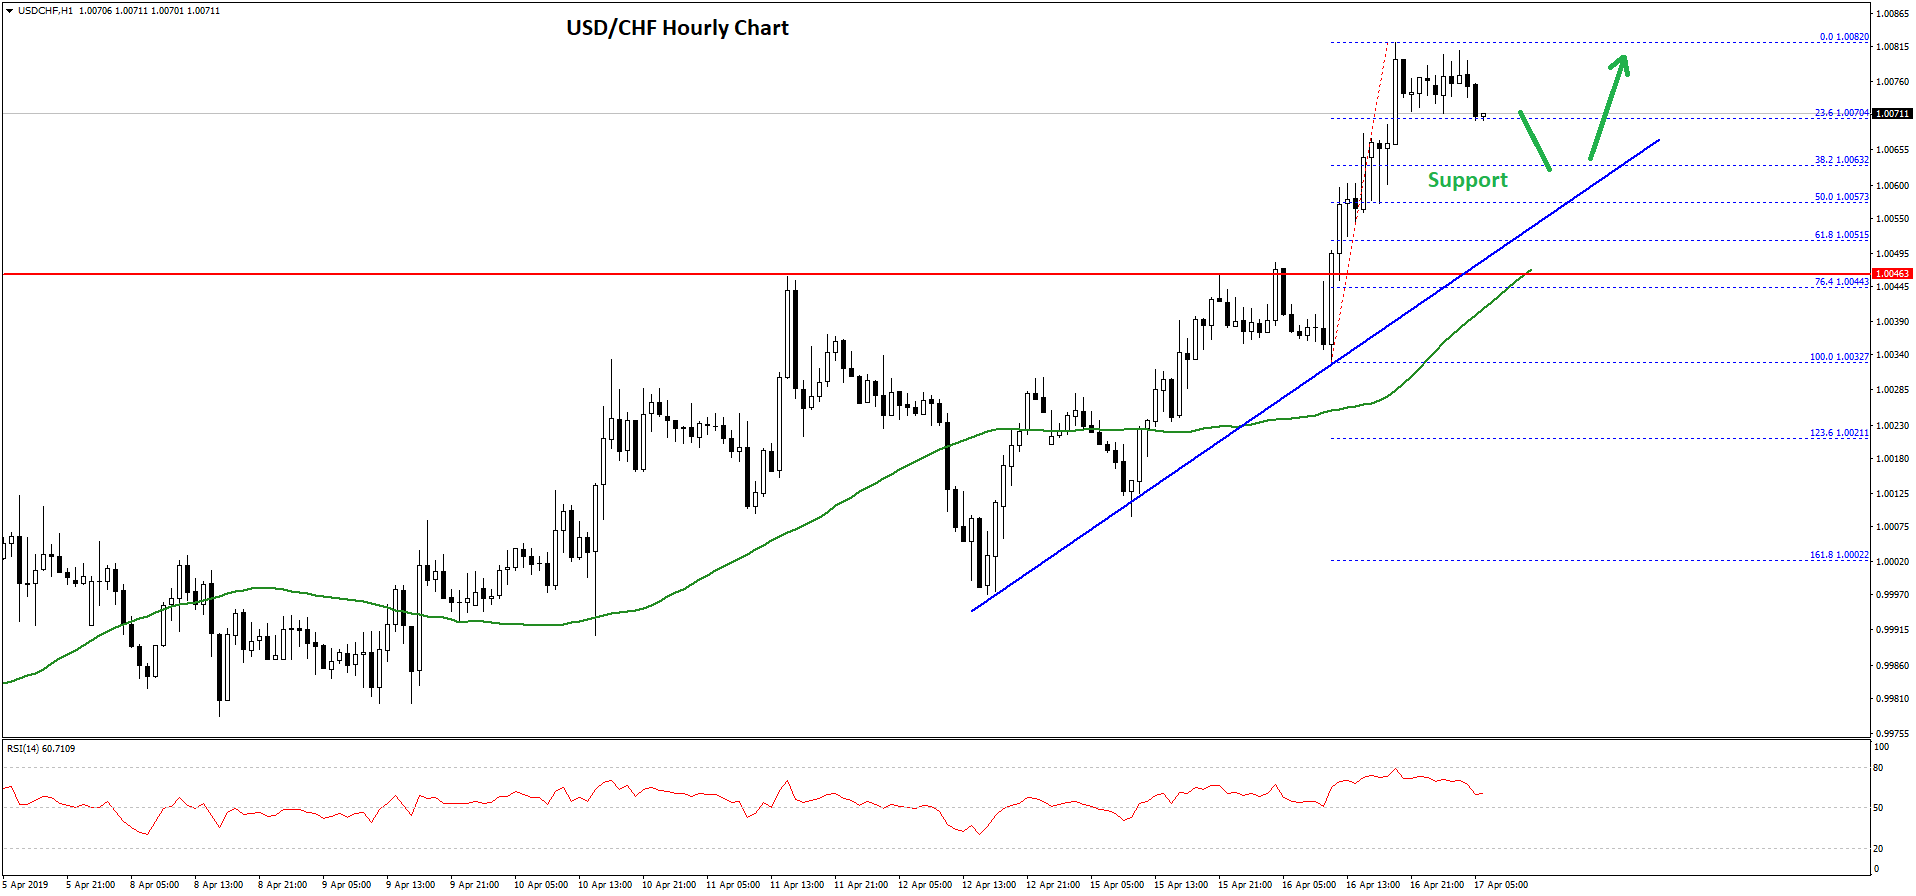
At the moment, the pair is correcting lower and trading near the 23.6% Fib retracement level of the recent wave from the 1.0032 low to 1.0082 high. On the downside, there are many supports near the 1.0060 and 1.0050 levels.
The main support is near 1.0055 and the 50% Fib retracement level of the recent wave from the 1.0032 low to 1.0082 high. There is also a crucial bullish trend line formed with support at 1.0050 on the hourly chart.
Therefore, if the pair corrects lower, it is likely to find buyers near the 1.0060 and 1.0050 levels. On the upside, an initial resistance is near the 1.0080 level, above which USD/CHF could test the 1.0100 level in the near term. Any further gains could push the pair towards the 1.0120 in the near term.
Trade over 50 forex markets 24 hours a day with FXOpen. Take advantage of low commissions, deep liquidity, and spreads from 0.0 pips. Open your FXOpen account now or learn more about trading forex with FXOpen.
This article represents the opinion of the Companies operating under the FXOpen brand only. It is not to be construed as an offer, solicitation, or recommendation with respect to products and services provided by the Companies operating under the FXOpen brand, nor is it to be considered financial advice.
Latest from Forex Analysis
Latest articles

Weekly Market Wrap With Gary Thomson: UK100, USD, GOLD, OIL
Get the latest scoop on the week's hottest headlines, all in one convenient video. Join Gary Thomson, the COO of FXOpen UK, as he breaks down the most significant news reports and shares his expert insights.
- UK100 Share Index Rises

What Is a Darvas Box Theory and How Does It Work in Trading?
The Darvas Box Theory, pioneered by Nicolas Darvas in the 1950s, has transcended its stock market origins to become a valuable tool for forex traders. This method leverages specific price movements and patterns, known as the Darvas Box, to track

NFLX Stock Price Falls Despite Subscriber Growth
Yesterday, after the close of the main trading session on the stock market, Netflix reported to investors for the 1st quarter of 2024.
The report turned out better than expected:
→ earnings per share: actual = USD 5.28, forecast = USD 4.