


FXOpen
EUR/USD remained well bid above the 1.0980 and 1.1000 levels and it could continue to rise. USD/CHF is currently holding an important support and it could climb above 1.0000.
Important Takeaways for EUR/USD and USD/CHF
- The Euro is showing positive signs above the key 1.0980 support area against the US Dollar.
- There is a major bearish trend line forming with resistance near 1.1040 on the hourly chart of EUR/USD.
- USD/CHF is facing a strong resistance near the 0.9990 and 1.0000 levels.
- There is a crucial bullish trend line forming with support near 0.9970 on the hourly chart.
EUR/USD Technical Analysis
Recently, there was an upward move in the Euro above the 1.1020 resistance against the US Dollar. The EUR/USD pair traded above the 1.1040 level, but it struggled to clear the 1.1060 resistance area.
A swing high was formed near 1.1060 on FXOpen and the pair corrected lower below the 50 hourly simple moving average. The pair traded below the 1.1020 support area and tested the 1.0990 area.
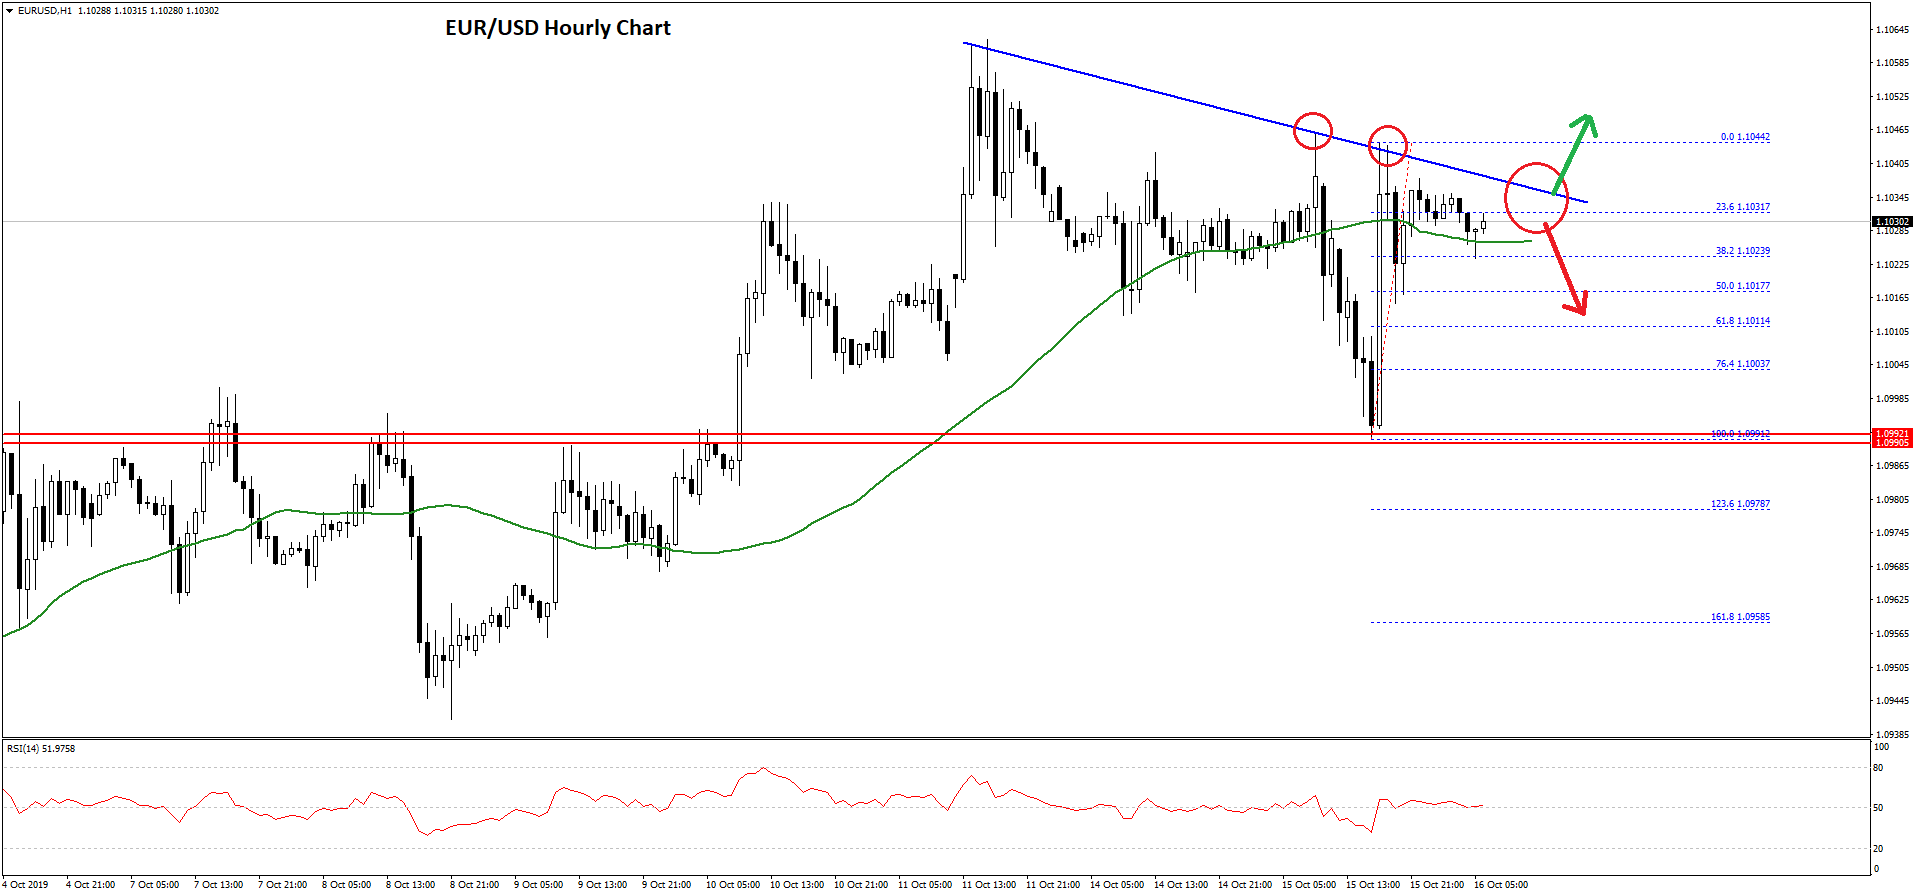
A low was formed near 1.0991 and the pair is currently climbing higher. The recent high was 1.1044 and the pair is trading near the 50 hourly SMA. Moreover, it tested the 38.2% Fib retracement level of the recent wave from the 1.0991 low to 1.1044 high.
On the upside, there is a strong resistance forming near the 1.1040 level. Besides, there is a major bearish trend line forming with resistance near 1.1040 on the hourly chart of EUR/USD.
If there is an upside break above the 1.1040 resistance, the pair could revisit the 1.1060 resistance. Any further gains could push the pair towards the 1.1080 level.
On the downside, an immediate support is near the 1.1015 level. It coincides with the 50% Fib retracement level of the recent wave from the 1.0991 low to 1.1044 high.
The main supports for EUR/USD are near 1.1000 and 1.0980, below which the pair could resume its decline and trade towards the 1.0950 level in the near term.
USD/CHF Technical Analysis
The US Dollar remained in a positive zone above the 0.9900 pivot level against the Swiss franc. The USD/CHF pair even climbed above the 0.9950 resistance, with mostly steady moves.
The upward move was such that the pair climbed above the 0.9980 resistance and the 50 hourly simple moving average. The pair traded close to the 1.0000 resistance and a high was formed near 0.9995.
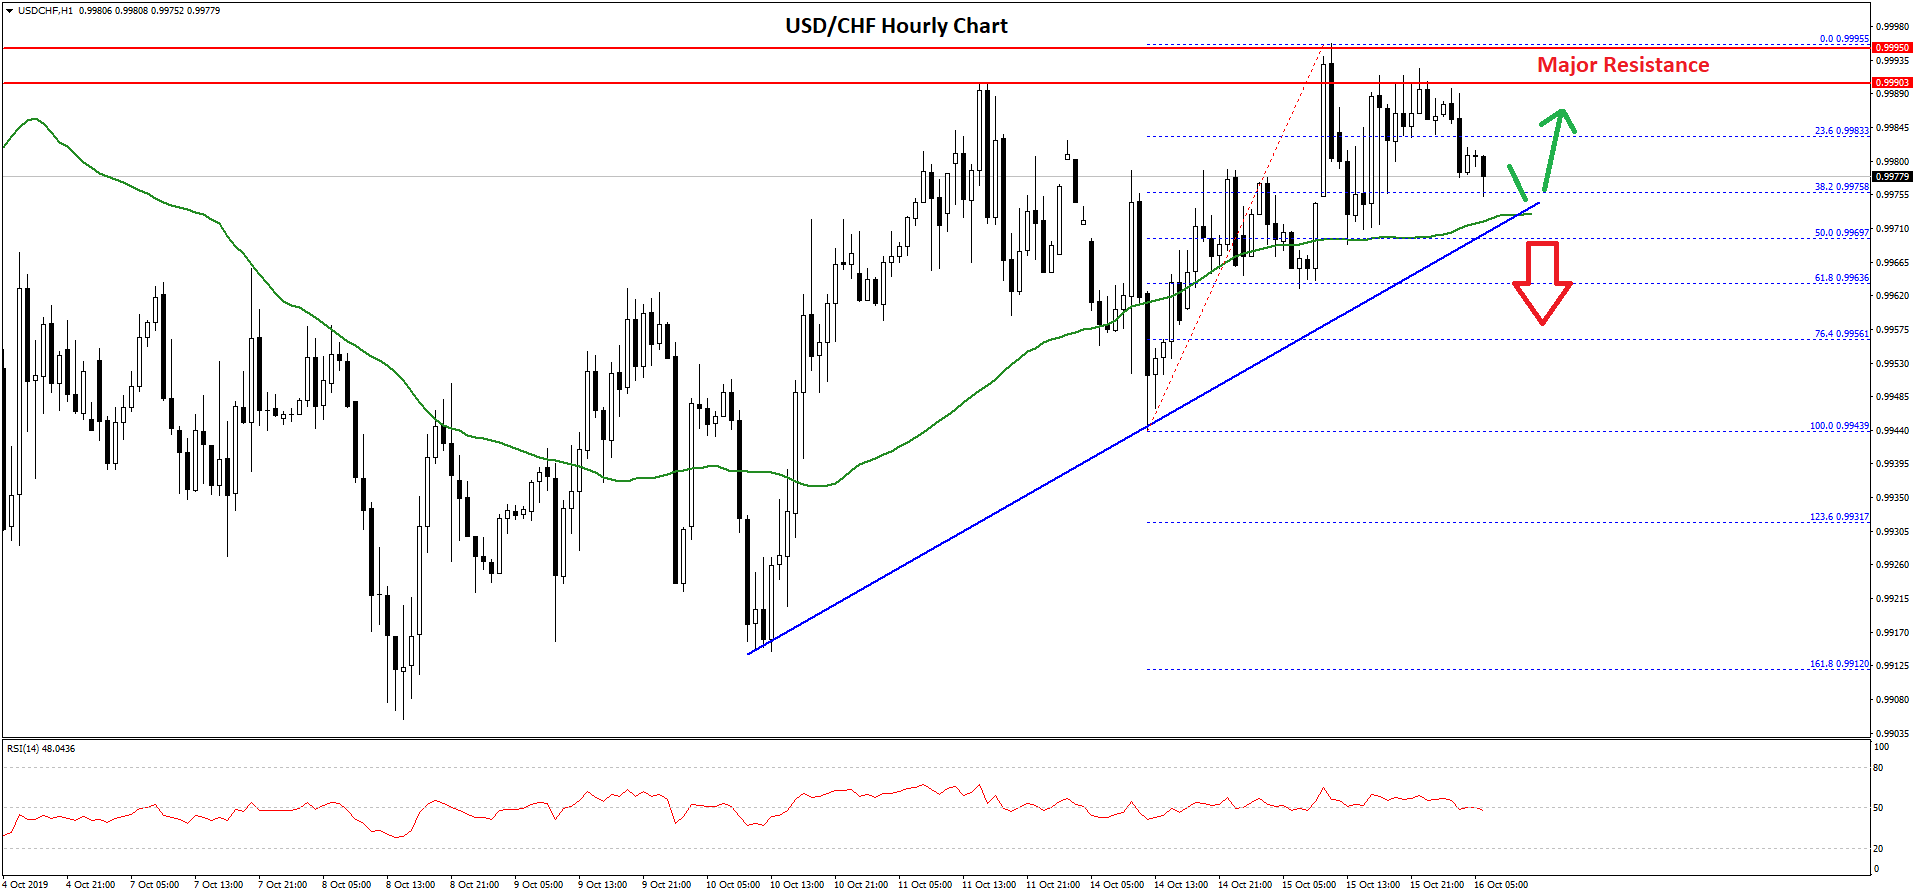
However, the pair failed to continue higher and declined below the 0.9985 level. There was a break below the 23.6% Fib retracement level of the last wave from the 0.9943 low to 0.9995 high.
There are key supports near the 0.9970 and 0.9975 levels. Moreover, the 50 hourly SMA is currently acting as a support near 0.9975. Besides, there is a crucial bullish trend line forming with support near 0.9970 on the hourly chart.
Additionally, the 50% Fib retracement level of the last wave from the 0.9943 low to 0.9995 high is also near 0.9970. Therefore, a break below the 0.9970 support level might push USD/CHF towards the 0.9950 support area.
On the upside, the main hurdle is near the 0.9990 and 1.0000 levels, above which there could be a sharp rise in the near term.
Trade over 50 forex markets 24 hours a day with FXOpen. Take advantage of low commissions, deep liquidity, and spreads from 0.0 pips. Open your FXOpen account now or learn more about trading forex with FXOpen.
This article represents the opinion of the Companies operating under the FXOpen brand only. It is not to be construed as an offer, solicitation, or recommendation with respect to products and services provided by the Companies operating under the FXOpen brand, nor is it to be considered financial advice.
Latest from Forex Analysis
Latest articles

Weekly Market Wrap With Gary Thomson: UK100, USD, GOLD, OIL
Get the latest scoop on the week's hottest headlines, all in one convenient video. Join Gary Thomson, the COO of FXOpen UK, as he breaks down the most significant news reports and shares his expert insights.
- UK100 Share Index Rises

What Is a Darvas Box Theory and How Does It Work in Trading?
The Darvas Box Theory, pioneered by Nicolas Darvas in the 1950s, has transcended its stock market origins to become a valuable tool for forex traders. This method leverages specific price movements and patterns, known as the Darvas Box, to track

NFLX Stock Price Falls Despite Subscriber Growth
Yesterday, after the close of the main trading session on the stock market, Netflix reported to investors for the 1st quarter of 2024.
The report turned out better than expected:
→ earnings per share: actual = USD 5.28, forecast = USD 4.