


FXOpen
EUR/USD formed support near the 1.1250 level and later bounced back above 1.1320. USD/CHF started a major decline and broke the 1.0040 and 1.0020 support levels.
Important Takeaways for EUR/USD and USD/CHF
- The Euro formed a solid support near the 1.1250 level and rebounded against the US Dollar.
- There was a break above a major bearish trend line with resistance near 1.1330 on the hourly chart of EUR/USD.
- USD/CHF started a downside move and traded below the 1.0060 support.
- There is a major bearish trend line formed with resistance at 1.0045 on the hourly chart.
EUR/USD Technical Analysis
After a major decline, the Euro found support near the 1.1250 level against the US Dollar. The EUR/USD pair formed a solid support base near 1.1250 and later started a decent rebound.
The pair traded above the 1.1275 and 1.1300 resistance levels before correction lower. A new swing low was formed at 1.1275 on FXOpen before the pair started a fresh upward move. It broke the 1.1320 resistance and the 50 hourly simple moving average.
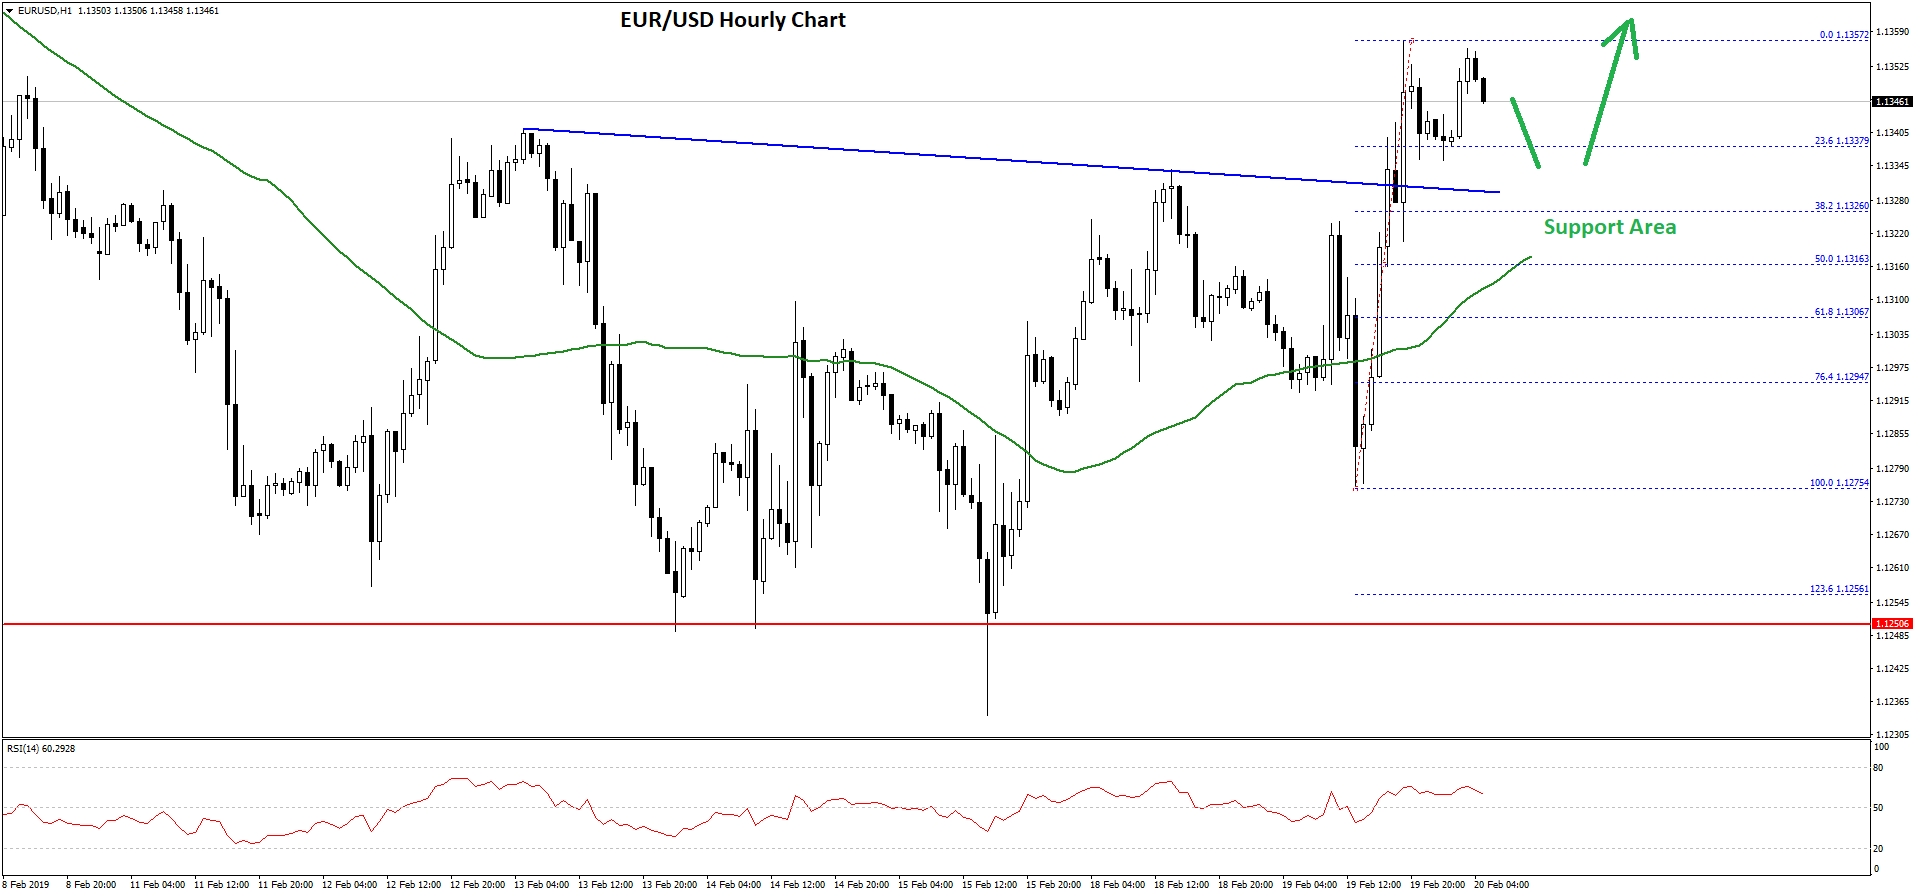
During the rise, there was a break above a major bearish trend line with resistance near 1.1330 on the hourly chart of EUR/USD. The pair even traded above the 1.1350 level and formed a high at 1.1357.
At the moment, the pair is correcting lower towards the 23.6% Fib retracement level of the last wave from the 1.1275 low to 1.1357 high. On the downside, there are many supports near the 1.1320 level and the broken trend line.
The main support is near the 1.1315 level and the 50 hourly simple moving average. It coincides with the 50% Fib retracement level of the last wave from the 1.1275 low to 1.1357 high.
Therefore, if the pair corrects lower, there are chances of a strong buying interest near the 1.1320 and 1.1315 levels. On the upside, the 1.1350 and 1.1360 levels are crucial hurdles for buyers. If there is a proper break above 1.1360, the pair could trade towards the 1.1400 level in the near term.
USD/CHF Technical Analysis
The US Dollar faced a strong selling interest near the 1.0090 and 1.0100 levels against the Swiss franc. The USD/CHF pair topped near the 1.0090 level and later started a major downside move.
The pair broke the 1.0060 and 1.0040 support levels to enter a bearish zone. Sellers even pushed the pair below the 1.0020 support and the 50 hourly simple moving average. A low was formed at 1.0002 and the pair is currently correcting higher.
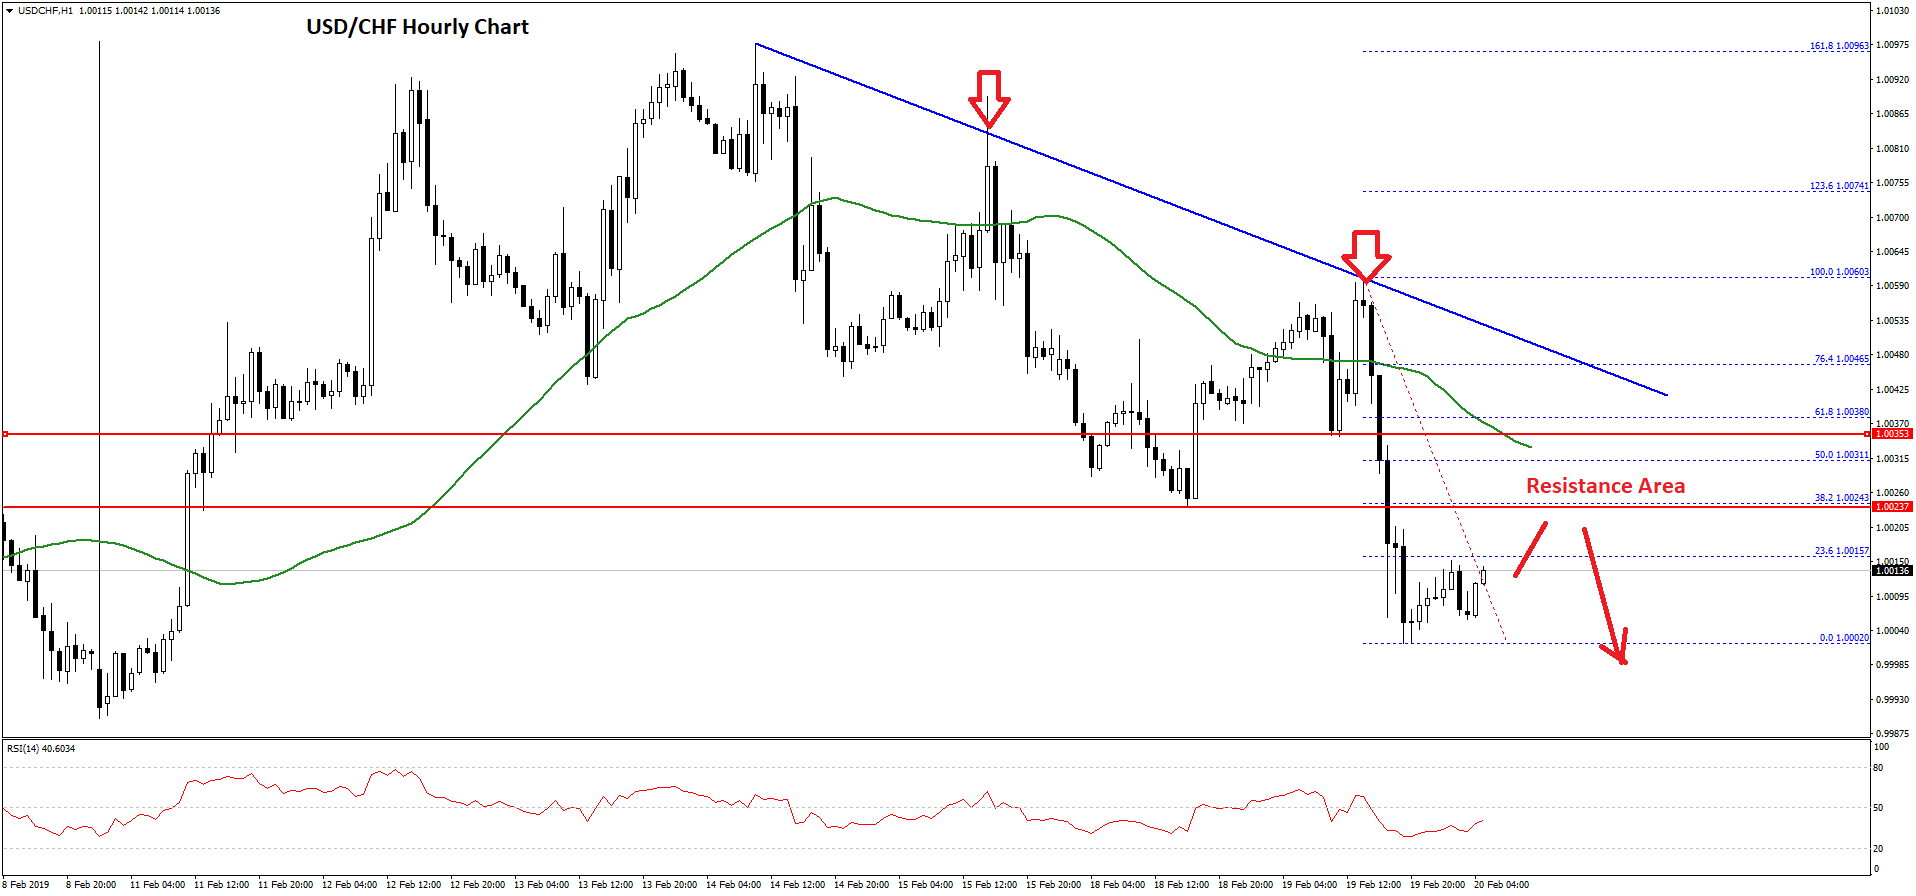
It is testing the 23.6% Fib retracement level of the last decline from the 1.0060 high to 1.0002 low. However, the main resistance is near the 1.0035 and the 50 hourly simple moving average.
There is also a major bearish trend line formed with resistance at 1.0045 on the hourly chart. Below the trend line, the 50% Fib retracement level of the last decline from the 1.0060 high to 1.0002 low is at 1.0031.
Therefore, if the pair corrects higher, it could face a strong selling interest near the 1.0030 and 1.0040 levels. Once the current correction wave is complete, there are chances of a fresh decline below the 1.0010 and 1.0000 support levels in the near term.
Trade over 50 forex markets 24 hours a day with FXOpen. Take advantage of low commissions, deep liquidity, and spreads from 0.0 pips. Open your FXOpen account now or learn more about trading forex with FXOpen.
This article represents the opinion of the Companies operating under the FXOpen brand only. It is not to be construed as an offer, solicitation, or recommendation with respect to products and services provided by the Companies operating under the FXOpen brand, nor is it to be considered financial advice.
Latest from Forex Analysis
Latest articles

Anchored VWAP and How You Can Use It in Forex Trading
In the world of forex trading, understanding the nuanced tools at your disposal can significantly enhance decision-making processes. One such sophisticated tool is the Anchored Volume-Weighted Average Price (Anchored VWAP), which refines the standard VWAP by allowing traders to set

META Share Price Collapses after Publication of Quarterly Report
Just yesterday, META's stock price closed at USD 493.50, up approximately 40% since the start of 2024 and up nearly 300% since the start of 2023.
However, following the release of Meta's quarterly report, its shares plummeted to USD

USD/JPY Analysis: The Rate Exceeds The Level of 155 Yen Per US Dollar
Today, the price of USD/JPY once again renewed its 34-year high, exceeding the level of 155 yen per dollar, which put pressure on the current authorities.
According to Reuters, officials are trying to maintain calm in the market.
"We