


FXOpen
EUR/USD recovered nicely and broke the 1.1325 resistance area to move into a positive zone. USD/CHF is currently under pressure, but it may recover in the short term.
Important Takeaways for EUR/USD and USD/CHF
- The Euro gained traction and broke the 1.1280 and 1.1325 resistance levels against the US Dollar.
- There is a key bullish trend line formed with support at 1.1340 on the hourly chart of EUR/USD.
- USD/CHF declined heavily and broke the 1.0040 and 1.0020 support levels.
- There is a major bearish trend line formed with resistance at 1.0000 on the hourly chart.
EUR/USD Technical Analysis
After traded below the 1.1240 support level, the Euro found a strong buying interest against the US Dollar. The EUR/USD pair started a solid upward move and broke the 1.1280 and 1.1325 resistance levels.
The recent upward move was strong as the pair even broke the 1.1340 resistance level and settled above the 50 hourly simple moving average. The pair traded as high as 1.1361 on FXOpen and it is currently correcting lower.
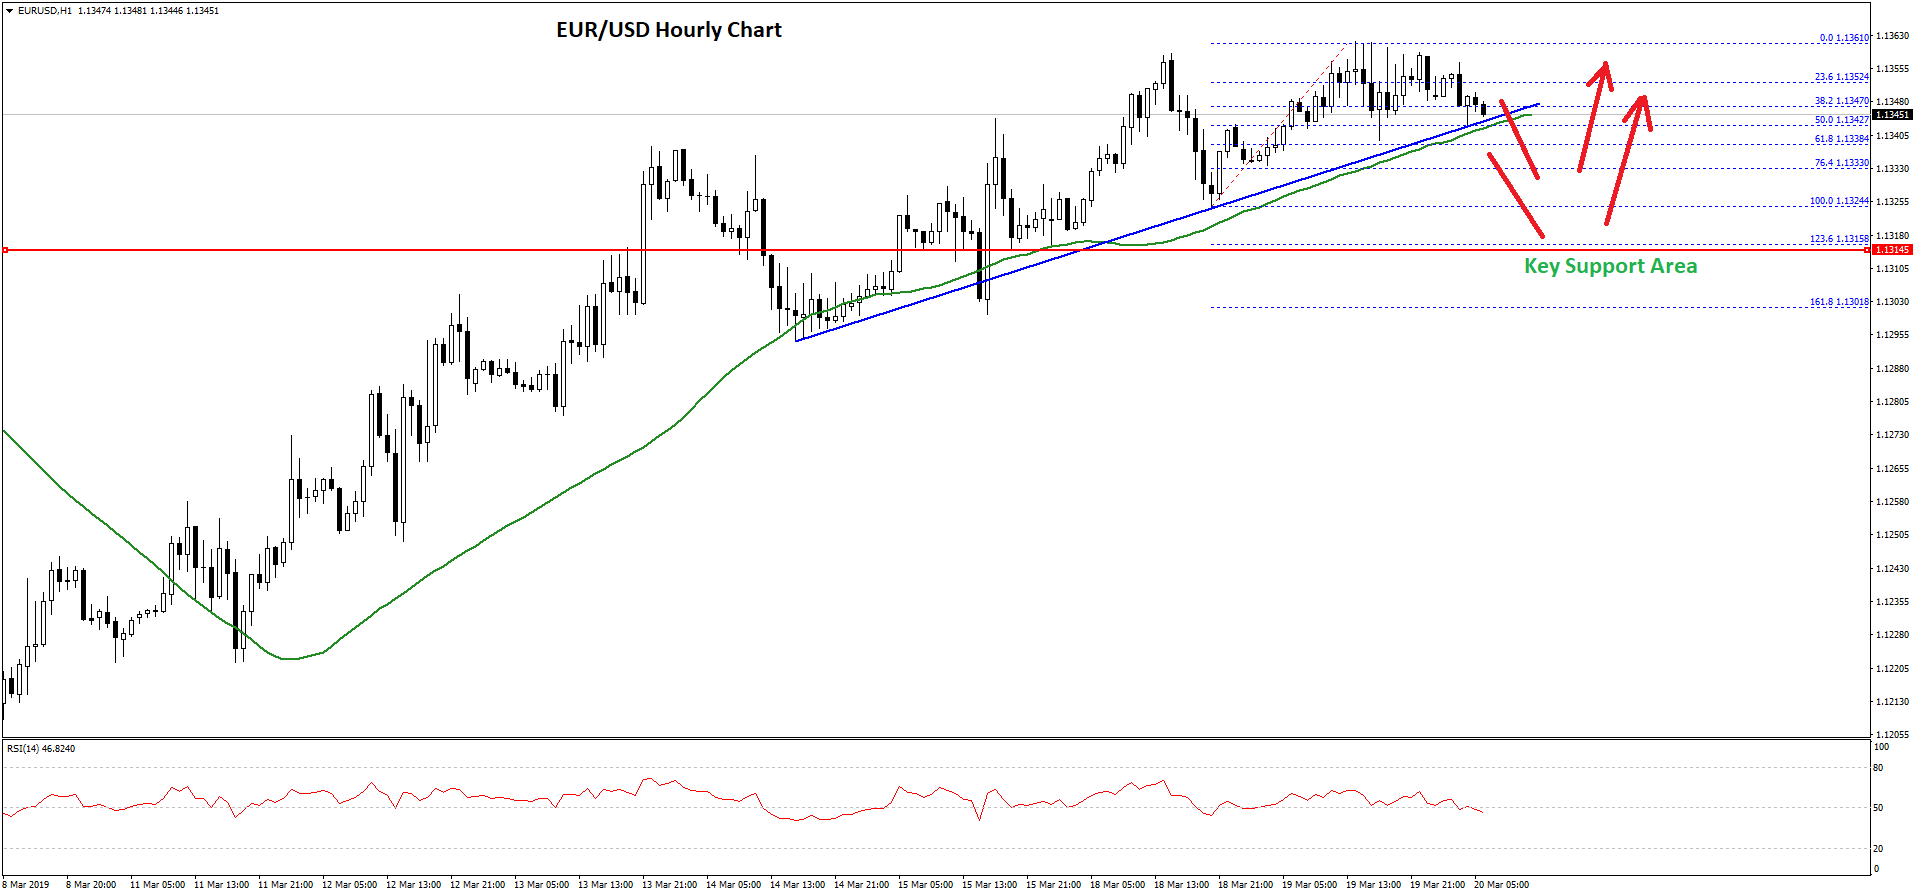
The pair corrected below the 1.1350 support and the 38.2% Fib retracement level of the recent wave from the 1.1324 low to 1.1361 high. However, there is a strong support formed above the 1.1345 level.
There is also a key bullish trend line formed with support at 1.1340 on the hourly chart of EUR/USD. The trend line is close to the 50% Fib retracement level of the recent wave from the 1.1324 low to 1.1361 high.
If there is a downside break below the trend line, the pair may correct lower towards the 1.1325 support zone. If sellers gain control, the pair could even test the 1.1300 support level, where buyers are likely to emerge.
On the upside, an initial resistance is near the 1.1360 zone, above which the pair is likely to climb towards the 1.1380 and 1.1400 resistance levels in the coming sessions.
USD/CHF Technical Analysis
The US Dollar started a significant downside move from the 1.0125 zone against the Swiss franc. The USD/CHF pair declined heavily and broke the 1.0100 and 1.0080 support levels to move into a bearish zone.
Sellers gained control and pushed the pair below the 1.0040 and 1.0020 support levels. There was even a close below the 1.0020 support and the 50 hourly simple moving average.
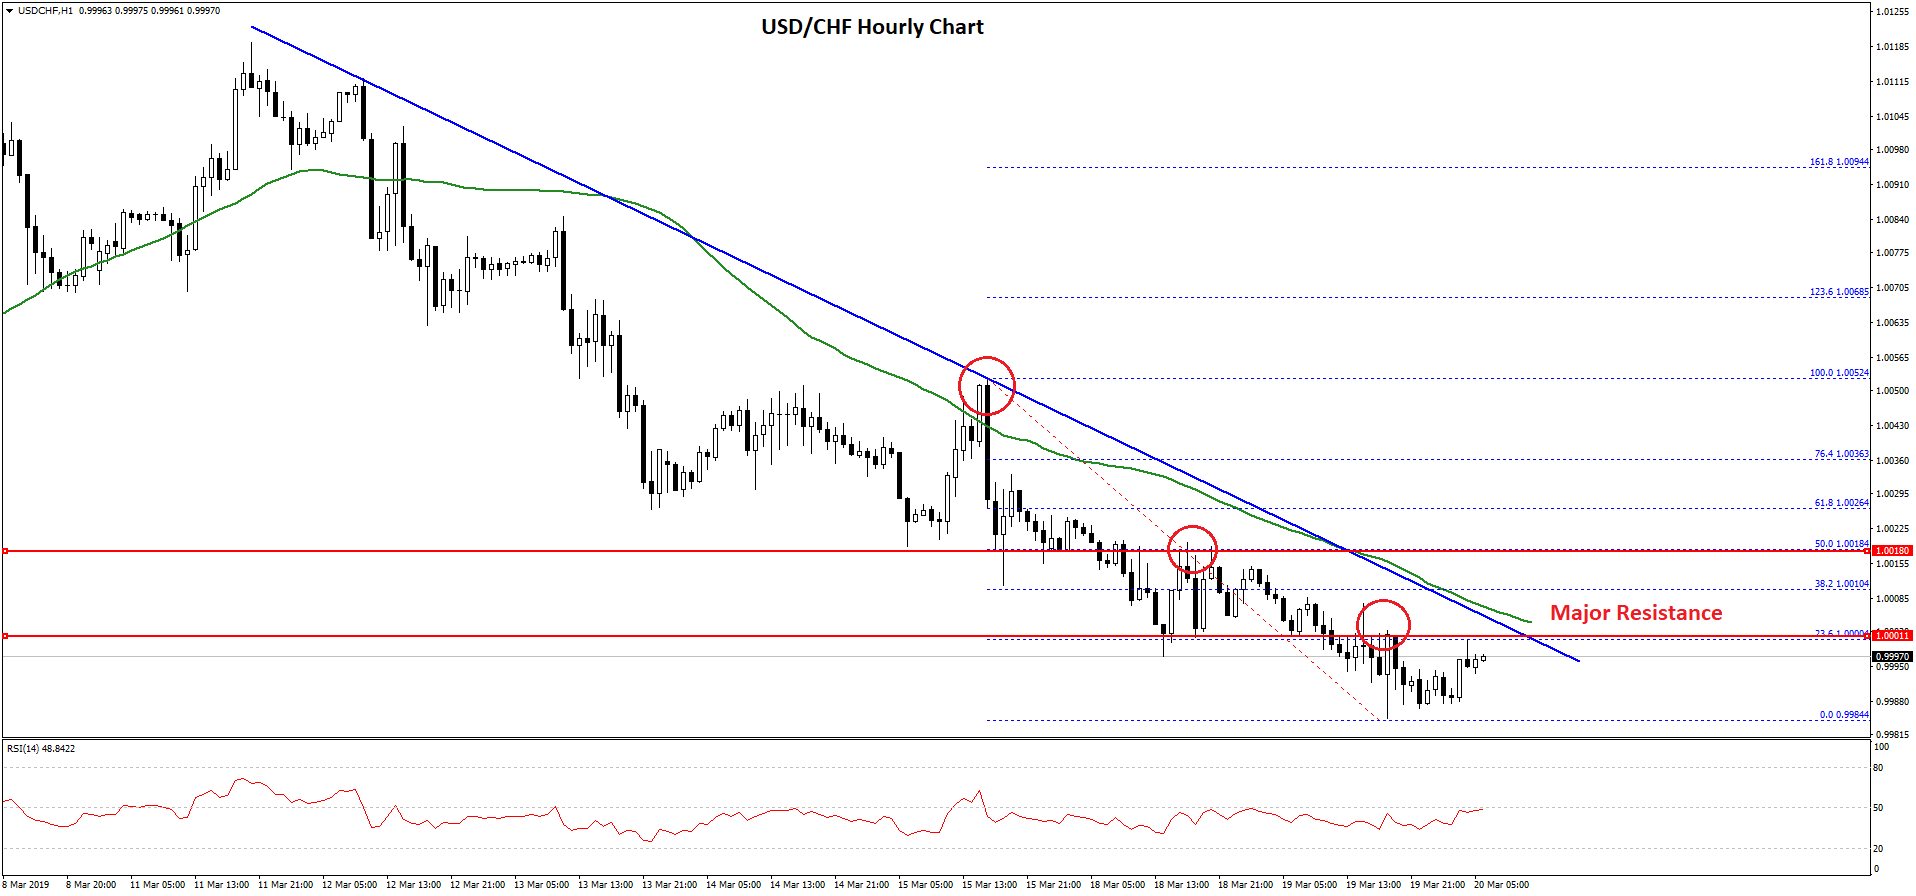
The pair traded as low as 0.9984 and it is currently correcting higher. It recently tested the 1.0000 resistance and the 23.6% Fib retracement level of the recent decline from the 1.0052 high to 0.9984 low.
It seems like there is a strong resistance formed near the 1.0000 and 1.0020 levels. There is also a major bearish trend line formed with resistance at 1.0000 on the hourly chart. The trend line also coincides with the 50 hourly SMA.
If there is an upside break above the trend line and the 50 hourly SMA, the pair could correct higher towards the 1.0020 level. It represents the 50% Fib retracement level of the recent decline from the 1.0052 high to 0.9984 low.
Sellers are likely to protect the 1.0020 resistance level. If they fail, the US Dollar could climb towards the 1.0050 resistance level. On the downside, an initial support is at 0.9985, followed by 0.9960.
Trade over 50 forex markets 24 hours a day with FXOpen. Take advantage of low commissions, deep liquidity, and spreads from 0.0 pips. Open your FXOpen account now or learn more about trading forex with FXOpen.
This article represents the opinion of the Companies operating under the FXOpen brand only. It is not to be construed as an offer, solicitation, or recommendation with respect to products and services provided by the Companies operating under the FXOpen brand, nor is it to be considered financial advice.
Latest from Forex Analysis
Latest articles

Anchored VWAP and How You Can Use It in Forex Trading
In the world of forex trading, understanding the nuanced tools at your disposal can significantly enhance decision-making processes. One such sophisticated tool is the Anchored Volume-Weighted Average Price (Anchored VWAP), which refines the standard VWAP by allowing traders to set

META Share Price Collapses after Publication of Quarterly Report
Just yesterday, META's stock price closed at USD 493.50, up approximately 40% since the start of 2024 and up nearly 300% since the start of 2023.
However, following the release of Meta's quarterly report, its shares plummeted to USD

USD/JPY Analysis: The Rate Exceeds The Level of 155 Yen Per US Dollar
Today, the price of USD/JPY once again renewed its 34-year high, exceeding the level of 155 yen per dollar, which put pressure on the current authorities.
According to Reuters, officials are trying to maintain calm in the market.
"We