


FXOpen
EUR/USD corrected lower and tested the 1.1660 support area. USD/JPY is moving nicely in a positive zone above the 112.00 support area.
Important Takeaways for EUR/USD and USD/JPY
- The Euro made a nice upside move, but it faced sellers near the 1.1720 level.
- There is a crucial bullish trend line in place with support at 1.1660 on the hourly chart of EUR/USD.
- USD/JPY settled above the 112.00 resistance and the 50 hourly simple moving average.
- There is a key bullish trend line in place with support at 112.00 on the hourly chart.
EUR/USD Technical Analysis
The Euro remained in a positive zone above the 1.1600 pivot level against the US Dollar. The EUR/USD pair gained traction and moved above the 1.1640 and 1.1650 resistance levels.
The pair also broke the 1.1700 barrier, but it faced a strong selling interest near the 1.1720 and 1.1730 levels. There was a sharp downside correction and the pair moved below the 1.1700 and 1.1680 levels. However, the previous resistance at 1.1650 acted as support.
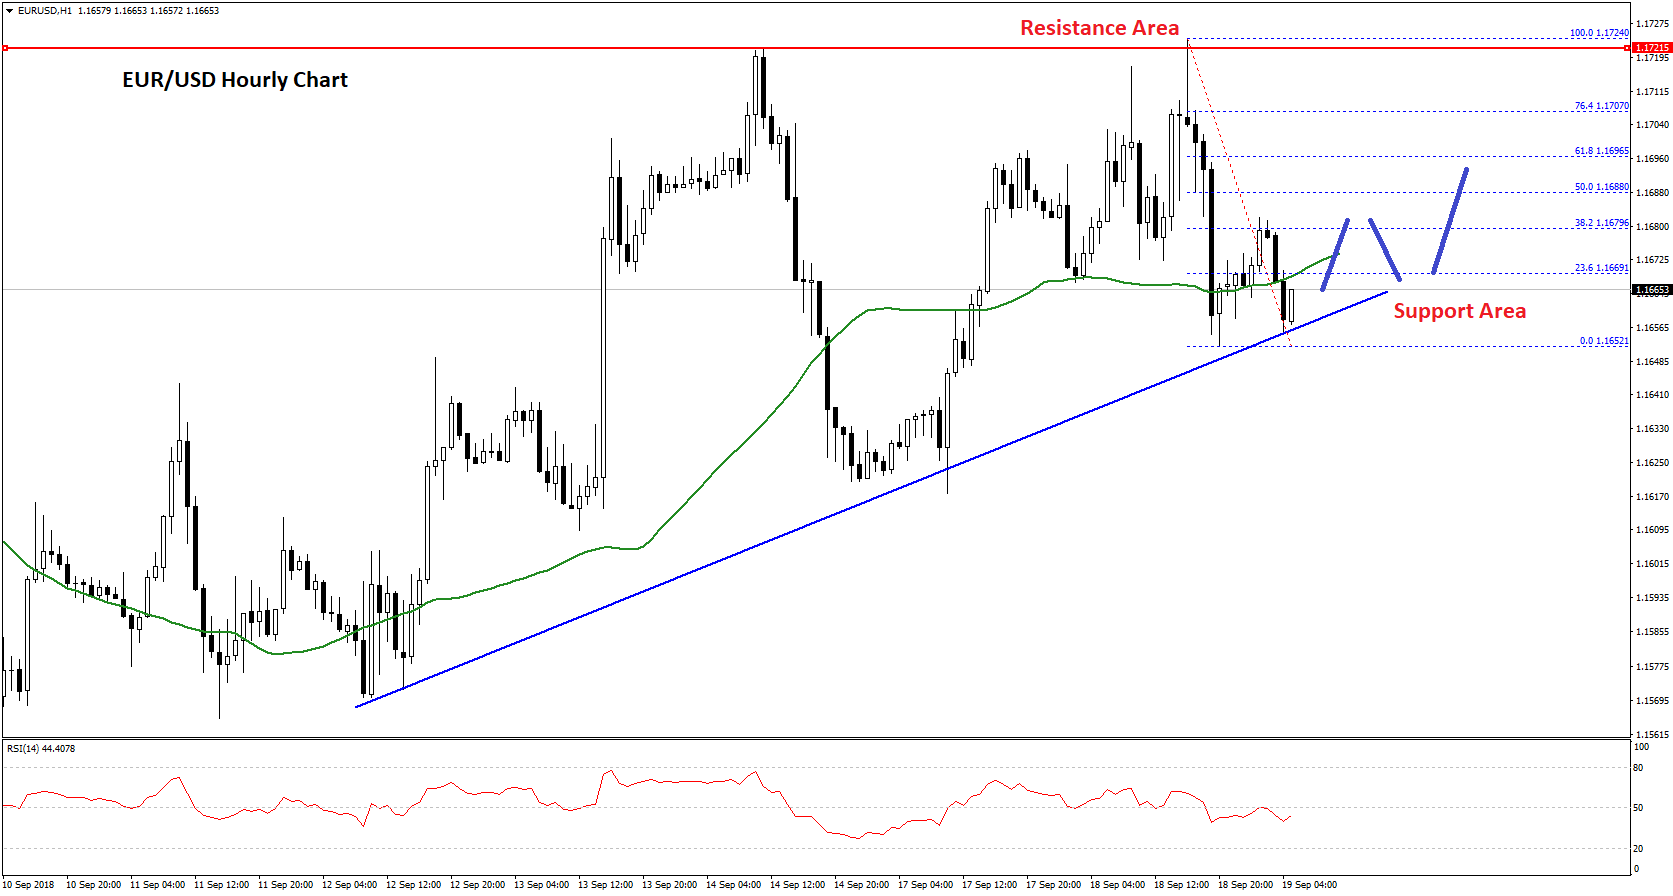
The pair is currently trading above the 1.1660 level and the 23.6% Fib retracement level of the last drop from the 1.1724 high to 1.1652 low, plus the 50 hourly simple moving average.
If the pair continues to move higher, it could test the 1.1680 and 1.1700 resistance levels. Moreover, the 50% Fib retracement level of the last drop from the 1.1724 high to 1.1652 low is at 1.1688 to act as a key hurdle for buyers.
Once there is a break and close above the 1.1700 level, the pair could retest the 1.1720 resistance. On the other hand, if the pair breaks a crucial bullish trend line with support at 1.1660 on the hourly chart, there may perhaps be more downsides towards the 1.1620 level in the near term.
Overall, EUR/USD is following a nice uptrend as long as it is above the 1.1650 level.
USD/JPY Technical Analysis
The US Dollar gained traction from the 111.50 swing low against the Japanese Yen. The USD/JPY pair jumped higher and broke many resistances, including 111.80 and 112.00.
There was also a close above the 112.00 resistance and the 50 hourly simple moving average. The recent high was formed at 111.38 and it seems like the pair may continue to move higher.
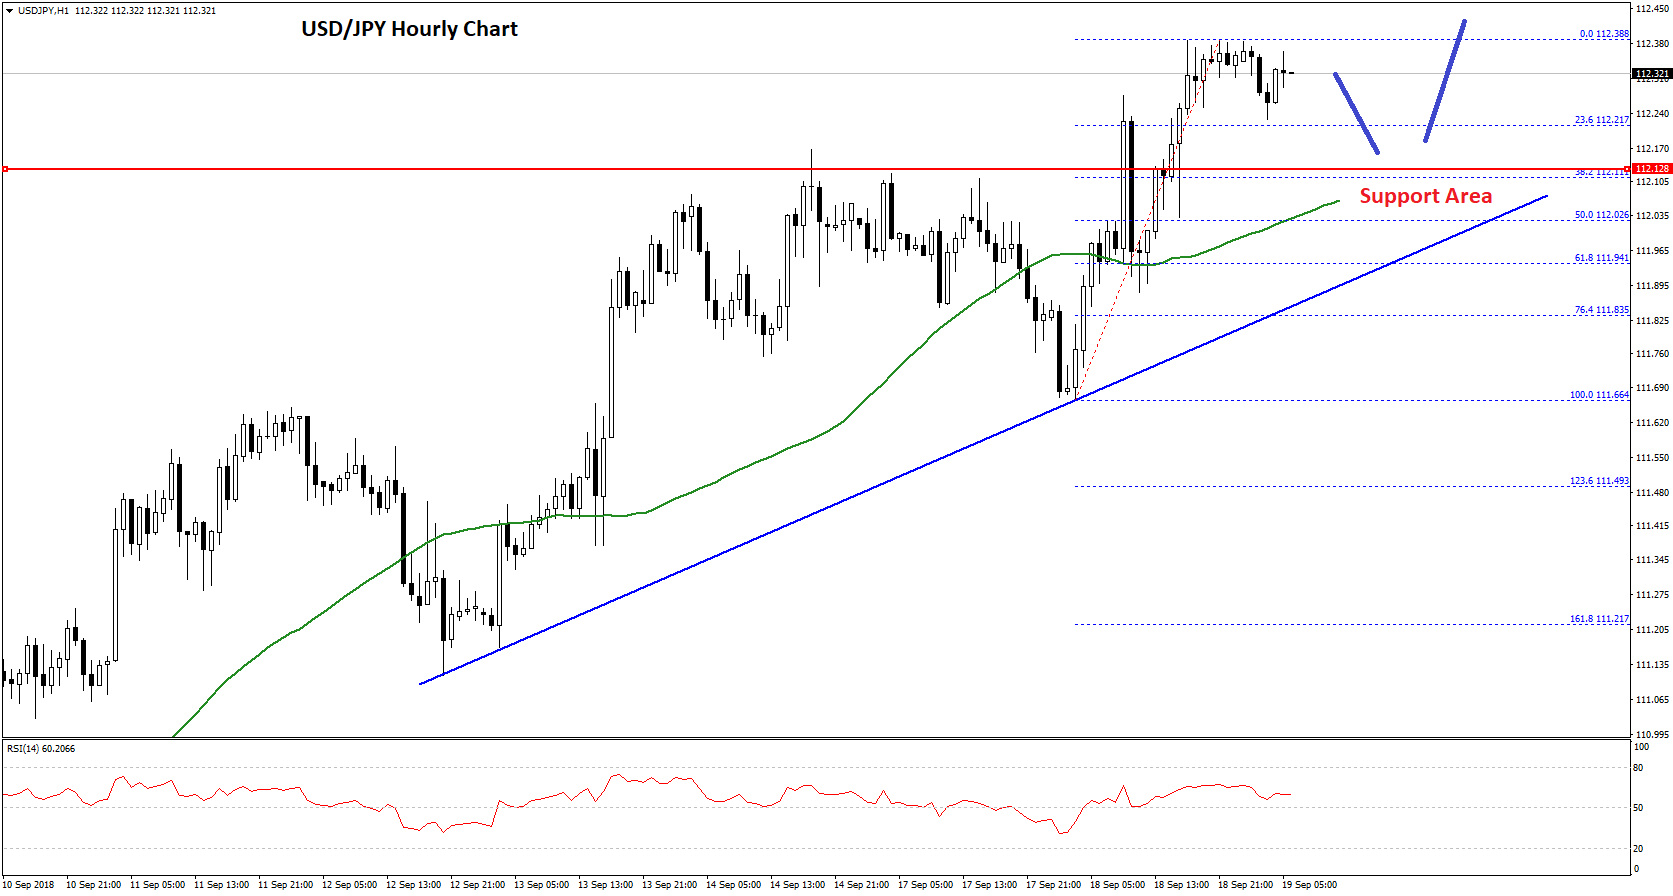
If there is a downside correction, an initial support is near the 23.6% Fib retracement level of the last wave from the 111.66 low to 112.38 high. Below the mentioned fib level, the previous resistance near 112.10 and 112.00 could act as support.
Moreover, there is a key bullish trend line in place with support at 112.00 on the hourly chart. The same trend line is near the 50% Fib retracement level of the last wave from the 111.66 low to 112.38 high. Finally, the 50 hourly SMA is positioned near the 112.08 level.
Therefore, if the pair dips from the current levels, it could find a strong support near the 112.00-112.10 zone.
On the upside, an initial resistance is near the 112.40 level, above which the price could accelerate above the 112.50 level. The next major hurdle above 112.50 is near the 112.80 level. Finally, the 113.00 level is likely to act as a strong resistance if buyers remain in control.
Trade over 50 forex markets 24 hours a day with FXOpen. Take advantage of low commissions, deep liquidity, and spreads from 0.0 pips. Open your FXOpen account now or learn more about trading forex with FXOpen.
This article represents the opinion of the Companies operating under the FXOpen brand only. It is not to be construed as an offer, solicitation, or recommendation with respect to products and services provided by the Companies operating under the FXOpen brand, nor is it to be considered financial advice.
Latest from Forex Analysis
Latest articles

Google Share Price Rose Post-market to a New All-time Record
Yesterday, after the close of the main trading session, a report on activities for the 1st quarter of Alphabet Inc. (Google's parent company) was published. The report was strong, exceeding investors' expectations.
→ Quarterly EPS = USD 1.89 (expected = USD 1.

S&P 500 Rebounds after Negative GDP News
Data released yesterday showed US GDP growth slowed to 1.6% in the first quarter of the year. According to ForexFactory: forecast = 2.2%, past value = 2.4%.
Reaction to the news sent the S&P 500 mini stock

GBP/USD And USD/CAD Daily Chart Outlook
GBP/USD is attempting a recovery wave from 1.2300. USD/CAD is consolidating and might aim for a move above the 1.3760 resistance zone.
Important Takeaways for GBP/USD and USD/CAD Analysis Today
· The British Pound started