


FXOpen
EUR/USD declined recently after it failed to break the 1.1260 resistance area. USD/JPY is currently trading in a broad range, with a strong resistance near the 112.00 zone.
Important Takeaways for EUR/USD and USD/JPY
- The Euro started a major decline after it failed to surpass the 1.1260 resistance.
- There was a break below a key bullish trend line with support at 1.1245 on the hourly chart of EUR/USD.
- USD/JPY is trading below two important bearish trend lines near 112.00 on the hourly chart.
- The pair could decline towards the 111.75 or 111.50 support in the short term.
EUR/USD Technical Analysis
The Euro started a major decline from the 1.1320 resistance area against the US Dollar. Later, the EUR/USD pair consolidated above the 1.1225 support area for a few hours and made an attempt to climb above the 1.1260 resistance.
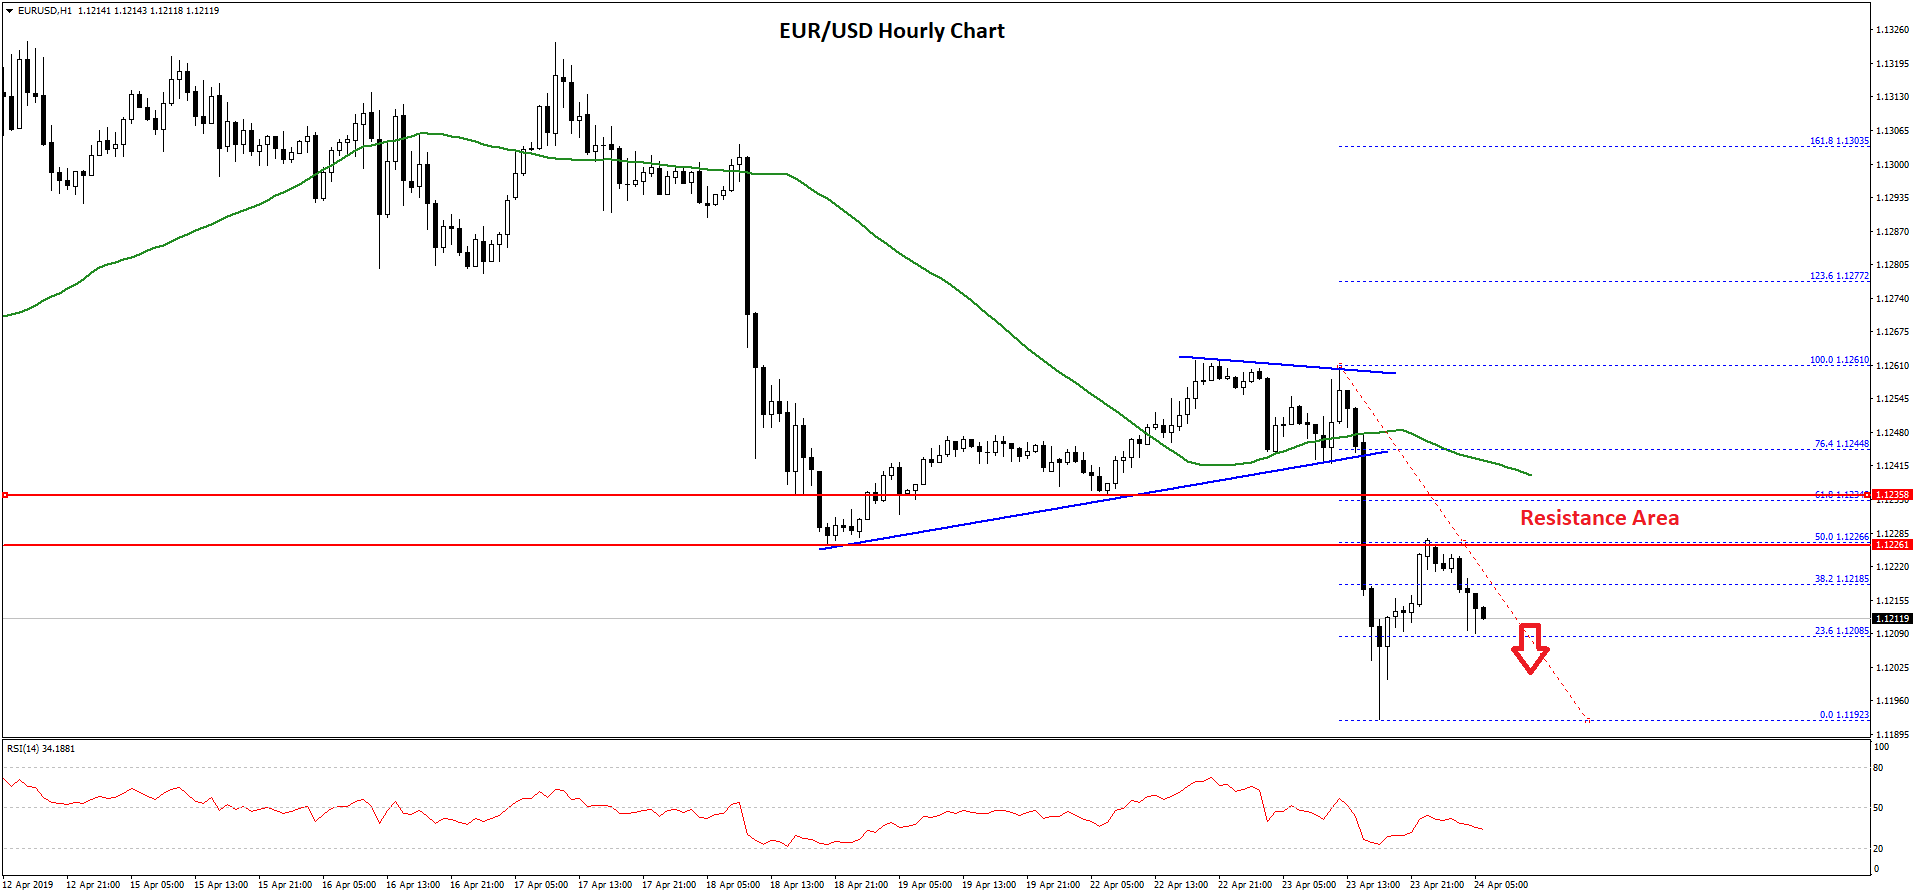
The bulls failed to gain traction above 1.1260, resulting in a downside extension below the 1.1240 and 1.1225 levels. The pair even settled below the 1.1240 level and the 50 hourly simple moving average. There was also a below a key bullish trend line with support at 1.1245 on the hourly chart of EUR/USD.
The pair traded as low as 1.1192 on FXOpen and recently corrected above the 1.1210 level. There was a break above the 38.2% Fib retracement level of the recent decline from the 1.1261 high to 1.1192 low.
However, the pair faced a strong resistance near the previous support at 1.1225. Besides, the 50% Fib retracement level of the recent decline from the 1.1261 high to 1.1192 low also acted as a significant resistance.
The pair was rejected near 1.1225 and it is currently moving lower. An initial support is near the 1.1205 level, below which the pair could decline further towards 1.1190 or 1.1170.
On the upside, the bulls need to clear the 1.1225 and 1.1240 resistance levels to start a decent rebound. The next key resistance is at 1.1260, above which the pair could revisit 1.1300.
USD/JPY Technical Analysis
The US Dollar remained below the 112.20 and 112.50 resistance levels against the Japanese Yen. The USD/JPY pair seems to be trading in a broad range below 112.00, with a slight bearish angle.
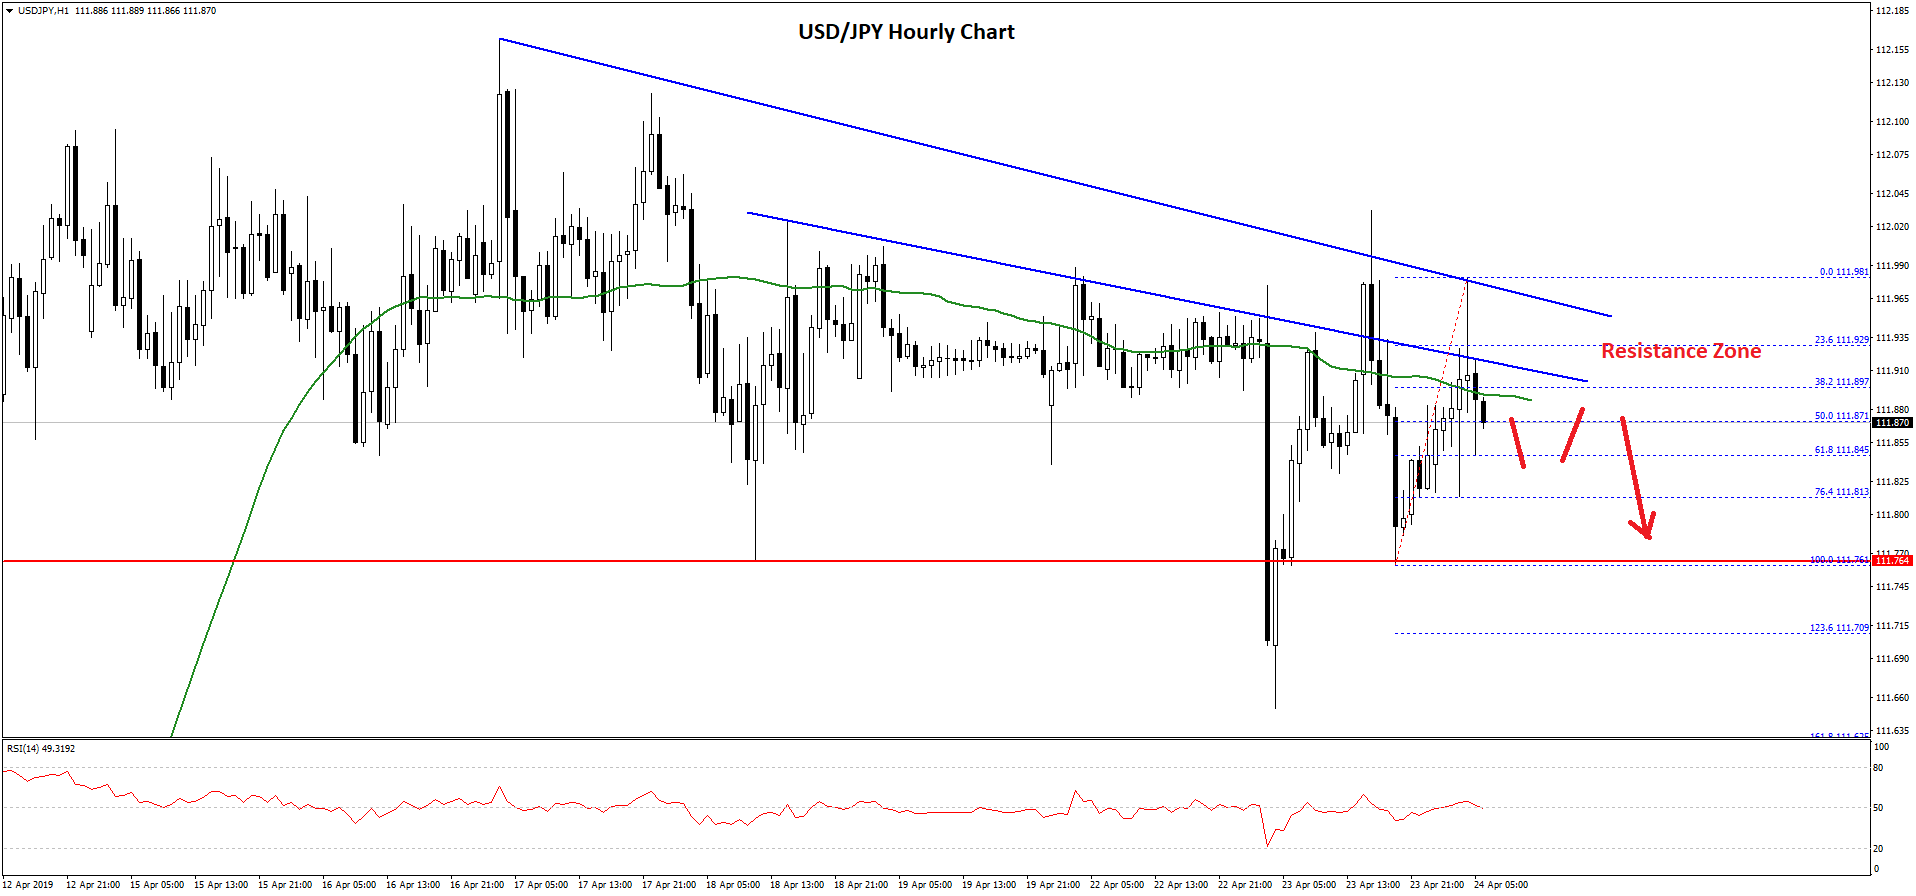
In the past few sessions, the pair dipped more than two times towards the 111.75 and 111.70 support levels. However, dips remained supported and the pair recovered above 111.85.
On the upside, there is a significant resistance forming near the 112.00 area and 50 hourly simple moving average. There are also two important bearish trend lines in place near 112.00 on the hourly chart.
The pair recently traded as high as 111.98 and corrected below the 50% Fib retracement level of the last wave from the 111.76 low to 111.98 high.
It seems like it could continue to move and retest the 111.75 or 111.70 support level. An intermediate support is at 111.80 and the 76.4% Fib retracement level of the last wave from the 111.76 low to 111.98 high.
On the upside, a successful break above 112.00 is needed for a positive trend formation towards the 112.50 level. On the other hand, a successful close below the 111.70 support will most likely spark more losses towards the 111.20 or 111.10 level in the coming sessions.
Trade over 50 forex markets 24 hours a day with FXOpen. Take advantage of low commissions, deep liquidity, and spreads from 0.0 pips. Open your FXOpen account now or learn more about trading forex with FXOpen.
This article represents the opinion of the Companies operating under the FXOpen brand only. It is not to be construed as an offer, solicitation, or recommendation with respect to products and services provided by the Companies operating under the FXOpen brand, nor is it to be considered financial advice.
Latest from Forex Analysis
Latest articles

Google Share Price Rose Post-market to a New All-time Record
Yesterday, after the close of the main trading session, a report on activities for the 1st quarter of Alphabet Inc. (Google's parent company) was published. The report was strong, exceeding investors' expectations.
→ Quarterly EPS = USD 1.89 (expected = USD 1.

S&P 500 Rebounds after Negative GDP News
Data released yesterday showed US GDP growth slowed to 1.6% in the first quarter of the year. According to ForexFactory: forecast = 2.2%, past value = 2.4%.
Reaction to the news sent the S&P 500 mini stock

GBP/USD And USD/CAD Daily Chart Outlook
GBP/USD is attempting a recovery wave from 1.2300. USD/CAD is consolidating and might aim for a move above the 1.3760 resistance zone.
Important Takeaways for GBP/USD and USD/CAD Analysis Today
· The British Pound started