


FXOpen

EUR/USD declined heavily in July and August 2019 before it found support near 1.0925. USD/JPY is also trading in a bearish zone below the main 107.50 and 108.00 resistance levels on the daily chart.
Important Takeaways for EUR/USD and USD/JPY
- The Euro broke many supports and settled below the key 1.1150 support against the US Dollar.
- There is a key bearish trend line forming with resistance near 1.1120 on the daily chart of EUR/USD.
- USD/JPY started consolidating gains with corrective moves from the 104.45 low.
- There is a major bearish trend line forming with resistance near 107.50 on the daily chart.
EUR/USD Technical Analysis
In the past few months, the Euro failed to gain bullish momentum and declined below the 1.1200 support level against the US Dollar. The EUR/USD pair declined heavily and broke the key 1.1150 support area.
Finally, there was a close below 1.1150 and the 50-day simple moving average. The pair declined to a new multi-month low at 1.0925 on FXOpen and recently started an upside correction.
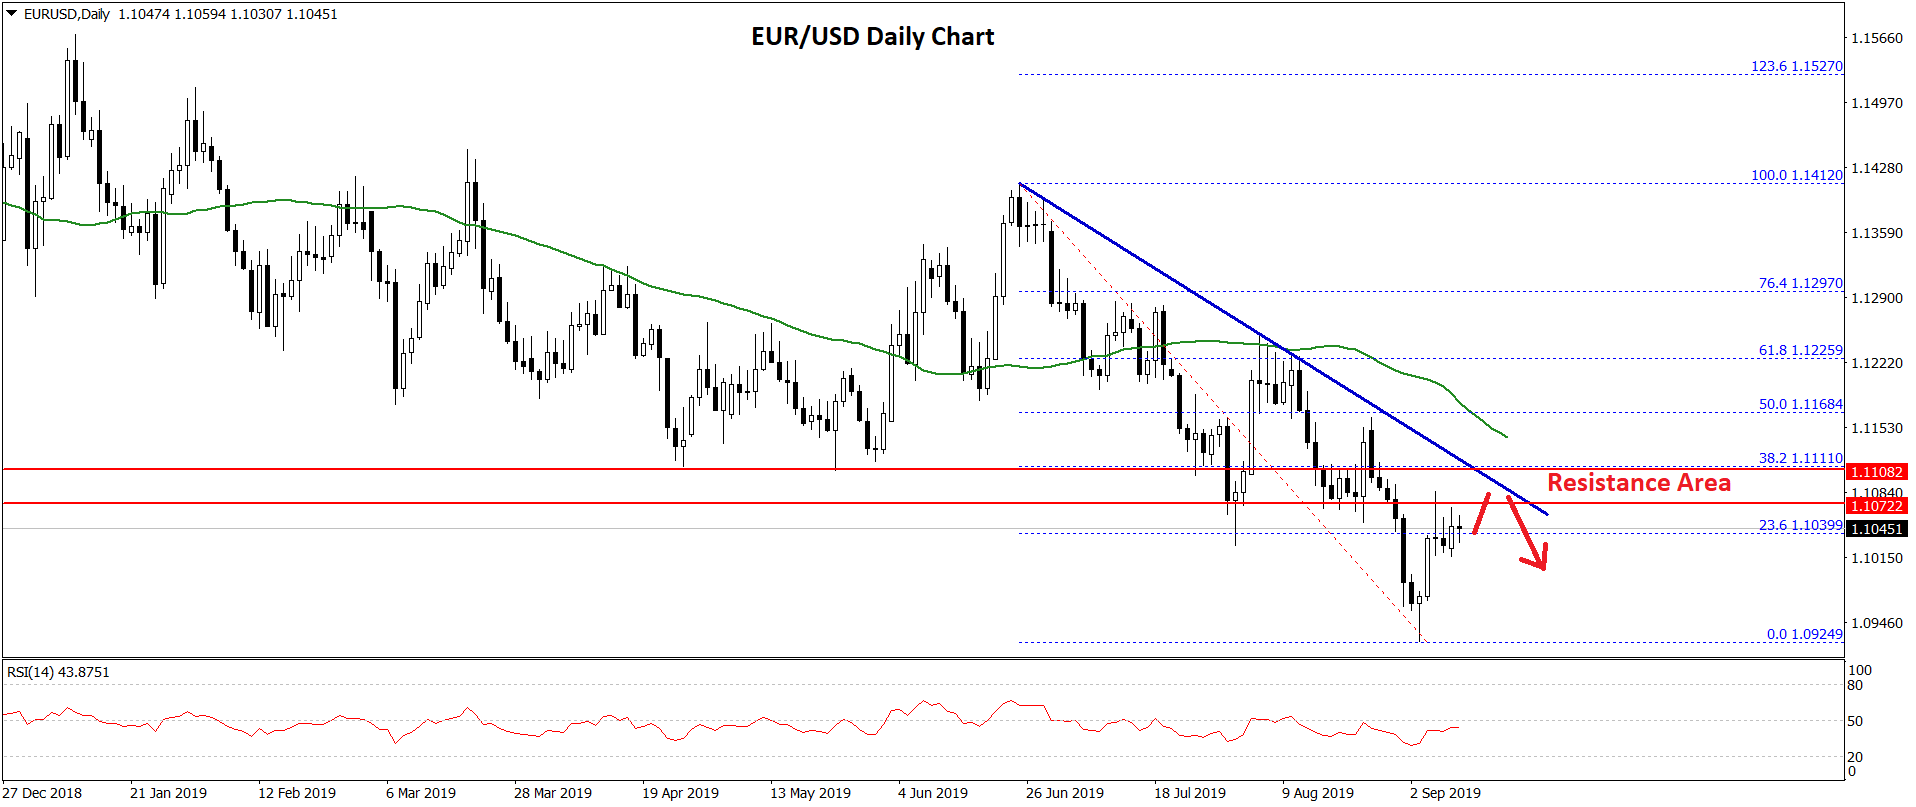
The pair recovered above the 1.0950 level and traded towards the 23.6% Fib retracement level of the last major decline from the 1.1412 high to 1.0925 low. On the upside, there are many important resistances near the 1.1000 levels.
Moreover, there is a key bearish trend line forming with resistance near 1.1120 on the daily chart of EUR/USD. The trend line coincides with the 38.2% Fib retracement level of the last major decline from the 1.1412 high to 1.0925 low.
Above the trend line, the next major resistance is near 1.1160 and the 50-day simple moving average. Therefore, a successful close above 1.1150 and 1.1160 is needed for a decent recovery.
Conversely, if EUR/USD fails to correct higher above the 1.1150 and 1.1160 resistance levels, it could resume its decline. An immediate support is near the 1.0925 swing low, below which the pair could decline towards 1.0800 or even 1.0750.
USD/JPY Technical Analysis
The US Dollar started following a bearish path after it was rejected near the 112.50 resistance level in April 2019. As a result, the USD/JPY pair broke many important supports near the 110.00 and 108.00 levels.
Moreover, there was a close below the key 108.00 support and the 50-day simple moving average. The pair declined to a new multi-month low at 104.45 and recently started an upside correction.
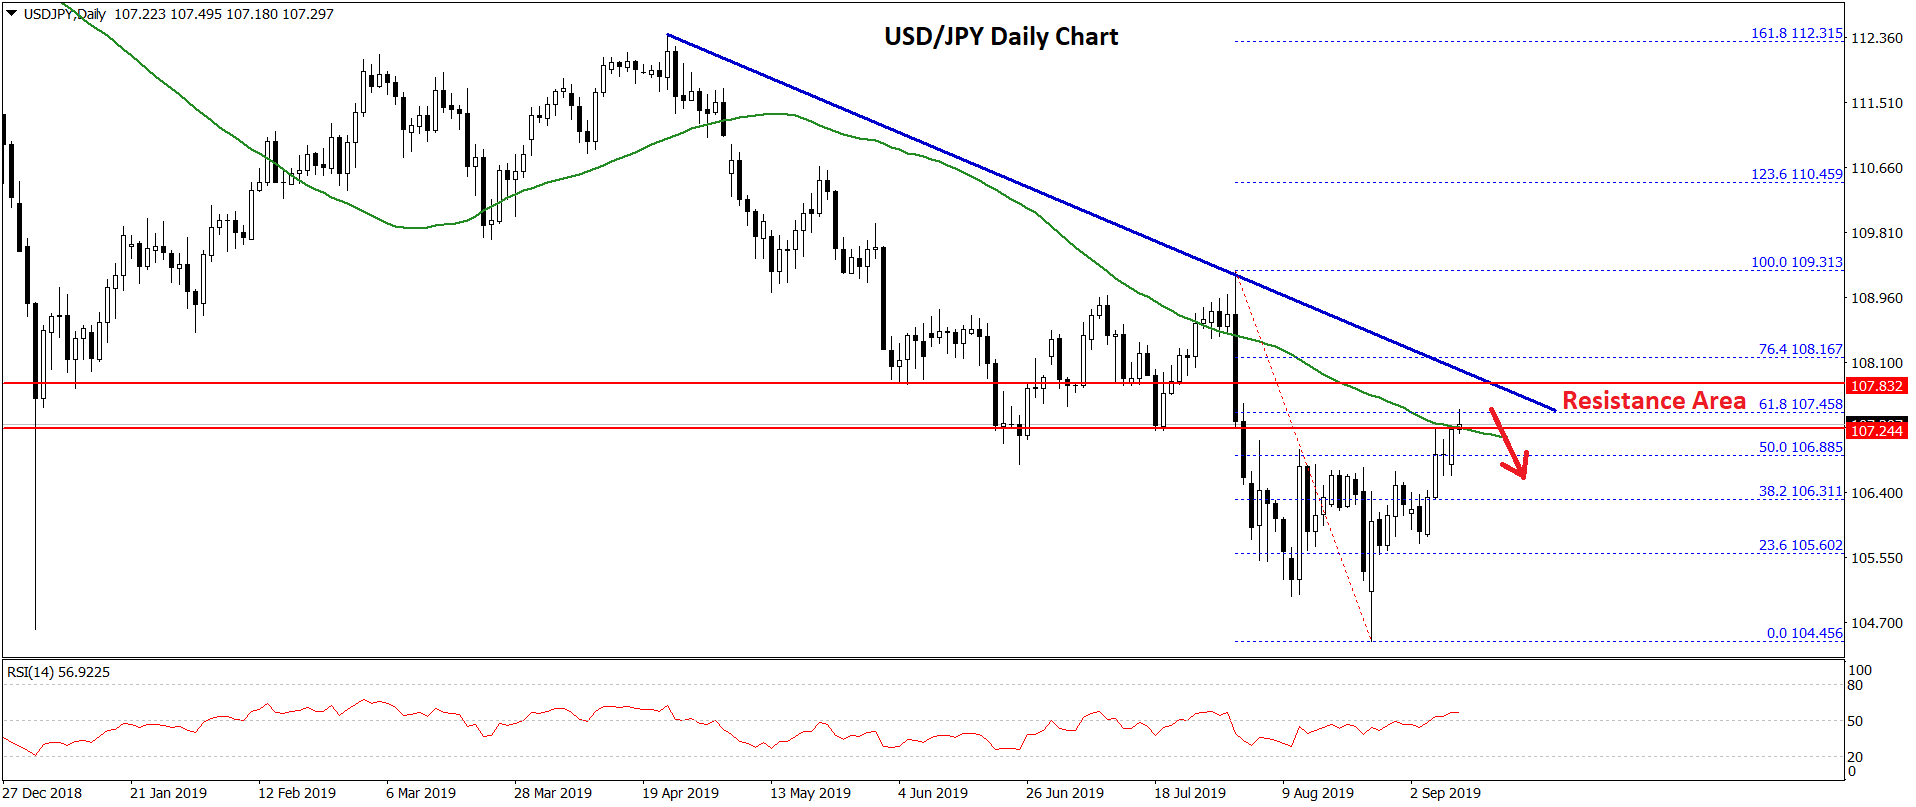
It corrected above the 105.50 level plus the 23.6% Fib retracement level of the last key decline from the 109.31 high to 104.45 low. However, there are many resistances on the upside near the 107.50 and 108.00 levels.
Moreover, there is a major bearish trend line forming with resistance near 107.50 on the daily chart. The trend line is close to the 50% Fib retracement level of the last key decline from the 109.31 high to 104.45 low.
Additionally, the 50-day simple moving average is positioned near the 107.25 level to act as a resistance. Therefore, the pair is likely to face a lot of hurdles near the 107.50 and 108.00 levels.
A successful close above 108.00 is likely to start a strong upward move towards 110.00 in the coming weeks. Conversely, if USD/JPY fails to break 108.00, it could retreat lower and revisit the 105.00 support area.
Trade over 50 forex markets 24 hours a day with FXOpen. Take advantage of low commissions, deep liquidity, and spreads from 0.0 pips. Open your FXOpen account now or learn more about trading forex with FXOpen.
This article represents the opinion of the Companies operating under the FXOpen brand only. It is not to be construed as an offer, solicitation, or recommendation with respect to products and services provided by the Companies operating under the FXOpen brand, nor is it to be considered financial advice.
Latest from Forex Analysis
Latest articles

Google Share Price Rose Post-market to a New All-time Record
Yesterday, after the close of the main trading session, a report on activities for the 1st quarter of Alphabet Inc. (Google's parent company) was published. The report was strong, exceeding investors' expectations.
→ Quarterly EPS = USD 1.89 (expected = USD 1.

S&P 500 Rebounds after Negative GDP News
Data released yesterday showed US GDP growth slowed to 1.6% in the first quarter of the year. According to ForexFactory: forecast = 2.2%, past value = 2.4%.
Reaction to the news sent the S&P 500 mini stock

GBP/USD And USD/CAD Daily Chart Outlook
GBP/USD is attempting a recovery wave from 1.2300. USD/CAD is consolidating and might aim for a move above the 1.3760 resistance zone.
Important Takeaways for GBP/USD and USD/CAD Analysis Today
· The British Pound started