


FXOpen
EUR/USD failed to recover above 1.1420 and declined recently. USD/JPY is currently correcting higher, but it could face resistance near the 113.20 level.
Important Takeaways for EUR/USD and USD/JPY
- The Euro is currently under pressure below the 1.1350 support level.
- There was a break below a key bullish trend line with support at 1.1345 on the hourly chart of EUR/USD.
- USD/JPY traded below a major bullish trend line with support at 113.45 on the hourly chart.
- The pair is currently recovering, but it could struggle near 113.20 or 113.40.
EUR/USD Technical Analysis
The Euro recovered nicely from the 1.1320 support area earlier this week against the US Dollar. The EUR/USD pair traded above the 1.1350 level, but the pair struggled to stay above the 1.1400 and 1.1420 resistance levels.
The pair formed a high at 1.1418 on FXOpen and later started a sharp downside move. Sellers pushed the pair below the 1.1350 support level and the 50 hourly simple moving average.
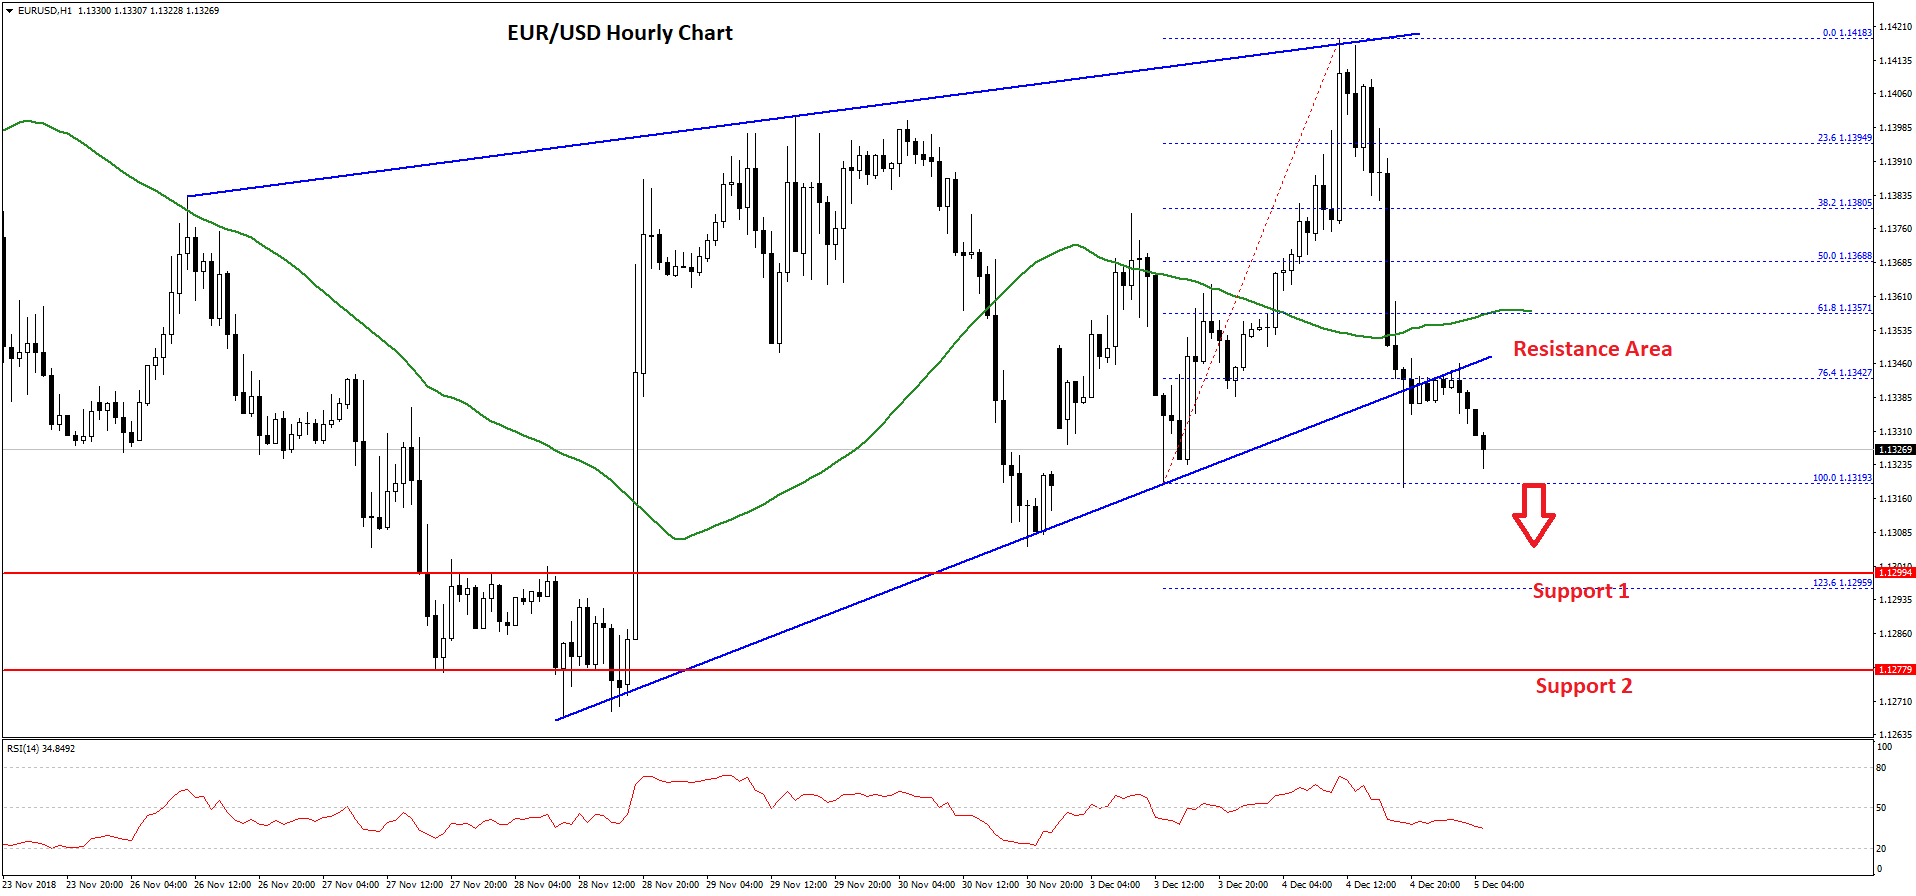
During the decline, the pair broke the 61.8% Fib retracement level of the last wave from the 1.1319 low to 1.1418 high. It opened the doors for more losses and the pair traded below a break below a key bullish trend line with support at 1.1345 on the hourly chart.
The pair even tested the last swing low at 1.1319. The current price action is very bearish and it seems like the pair could continue to move down below 1.1320.
The next major support is near the 1.1295 level, which is the 1.236 Fib extension level of the last wave from the 1.1319 low to 1.1418 high. If there are more losses, the pair may slide back towards the 1.1250 support level.
On the upside, an initial resistance is near the 1.1350 level, which was a support earlier and it could now prevent upsides in the near term along with the 100 hourly SMA.
USD/JPY Technical Analysis
The US Dollar started a major downside move from the 114.00 swing high against the Japanese Yen. The USD/JPY pair traded below the 113.80 and 113.50 support levels to enter a bearish zone.
An intermediate support was formed at 113.20 and later the pair bounced back. However, it failed near the 113.80 level and declined once again. The recent decline was such that the pair broke the 113.20 support level and the 50 hourly simple moving average.
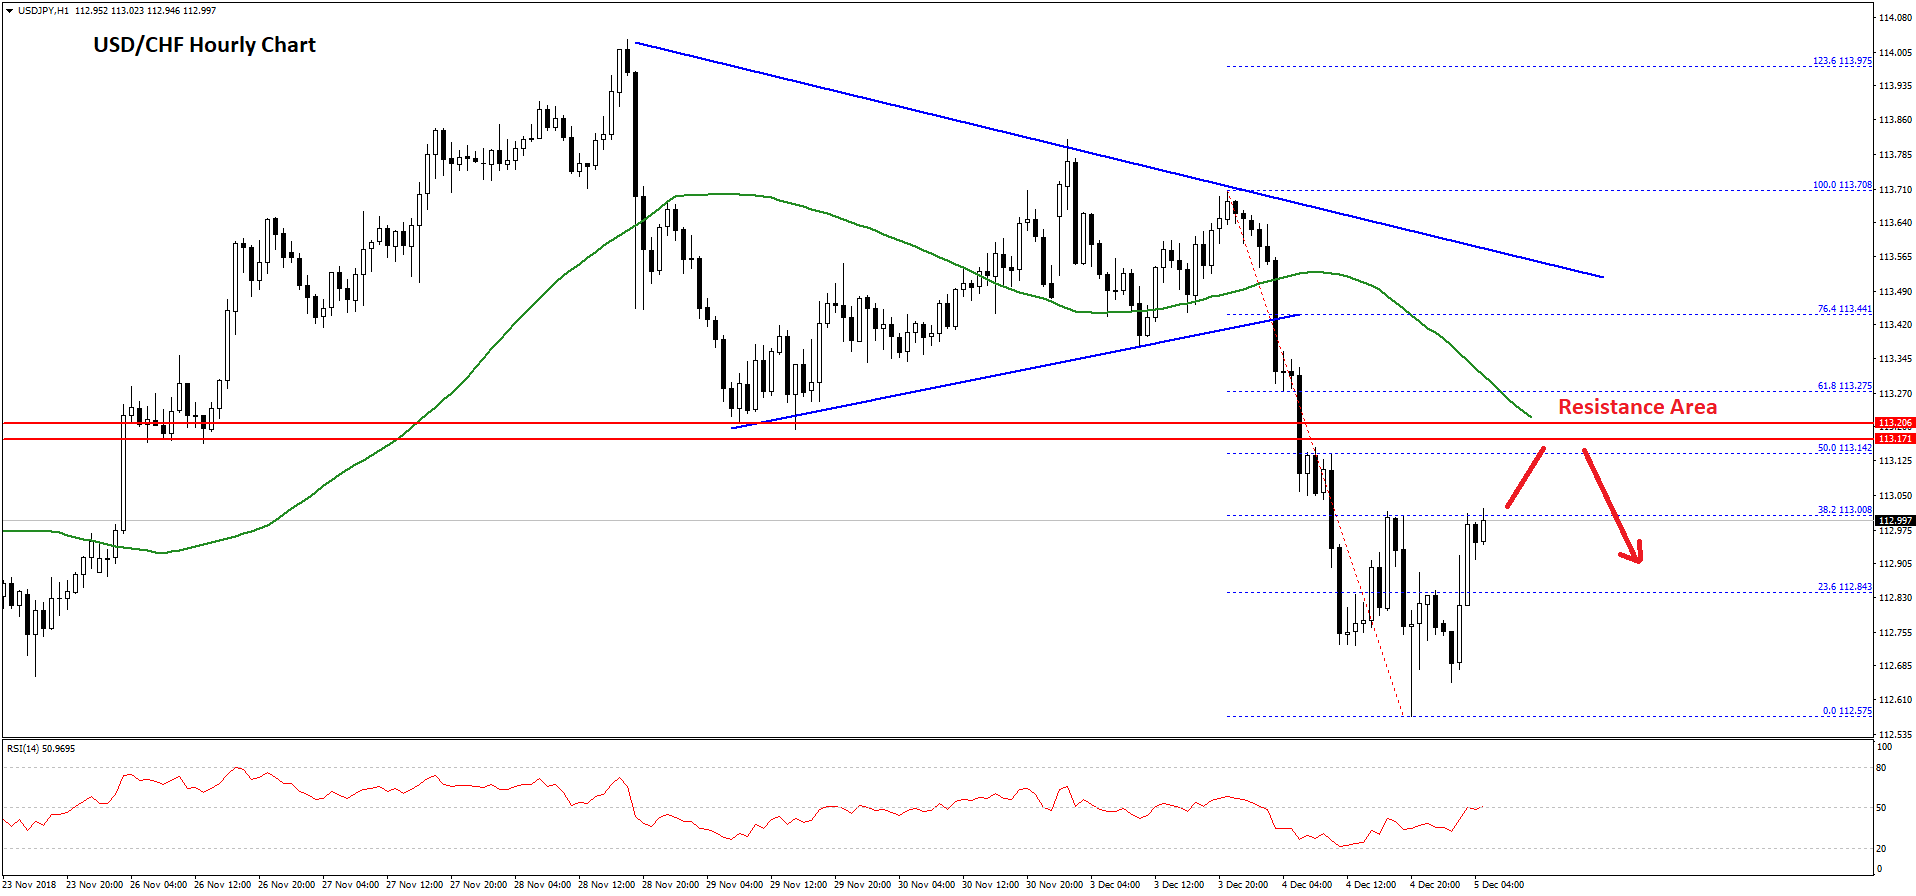
Moreover, there was a break below a major bullish trend line with support at 113.45 on the hourly chart. The pair declined towards the 112.50 level and traded as low as 112.57.
The pair is currently correcting higher above 112.80 and the 23.6% Fib retracement level of the recent decline from the 113.70 high to 112.57 low. However, there is a strong resistance formed near the 113.20 level.
The 113.20 level was a support level earlier and now it could act as a resistance along with the 50% Fib retracement level of the recent decline from the 113.70 high to 112.57 low.
Therefore, if USD/JPY corrects higher in the short term, it is likely to face a lot of offers near the 113.20 and 113.40 levels. On the downside, an initial support is at 112.80, below which the pair could decline towards the 112.50 level.
Trade over 50 forex markets 24 hours a day with FXOpen. Take advantage of low commissions, deep liquidity, and spreads from 0.0 pips. Open your FXOpen account now or learn more about trading forex with FXOpen.
This article represents the opinion of the Companies operating under the FXOpen brand only. It is not to be construed as an offer, solicitation, or recommendation with respect to products and services provided by the Companies operating under the FXOpen brand, nor is it to be considered financial advice.
Latest from Forex Analysis
Latest articles

Escalation Between Iran and Israel: How the Price of Brent Oil Reacts
On the night of Thursday into Friday, reports emerged that Israel had attacked Iran following Iran's attack on Israel over the weekend.
Let's remember that we wrote on Monday that after a 300 drone and missile attack on Israel over

Commodity Currencies at Strategic Levels. What Can Affect a Breakdown Downwards?
The decline in investor expectations regarding a change in the vector of the Fed's monetary policy contributes to the fall of not only European, but also commodity currencies. So, in recent weeks:
- AUD/USD has lost more than 200 points

Market Analysis: AUD/USD and NZD/USD Turn Red
AUD/USD declined below the 0.6500 and 0.6455 support levels. NZD/USD is also moving lower and might struggle to recover above 0.5950.
Important Takeaways for AUD/USD and NZD/USD Analysis Today
· The Aussie Dollar started