


FXOpen

EUR/USD failed to stay above 1.1320 and started a downward move towards 1.1200. USD/JPY is currently trading in a bearish zone below the 107.80 and 108.00 resistance levels.
Important Takeaways for EUR/USD and USD/JPY
- The Euro started a major decline from the 1.1400 resistance zone.
- There is a key bearish trend line forming with resistance near 1.1320 on the hourly chart of EUR/USD.
- USD/JPY declined heavily and broke the 108.50 and 108.00 support levels.
- There is a short term ascending channel forming with support near 107.20 on the hourly chart.
EUR/USD Technical Analysis
This week, the Euro gained traction above the 1.1320 resistance zone against the US Dollar. The EUR/USD pair even broke the 1.1380 resistance and spiked above the 1.1400 level.
However, it failed to stay in a positive zone and recently started a sharp decline below 1.1350. There was a break below the 1.1320 support level and the pair settled below the 50 hourly simple moving average.
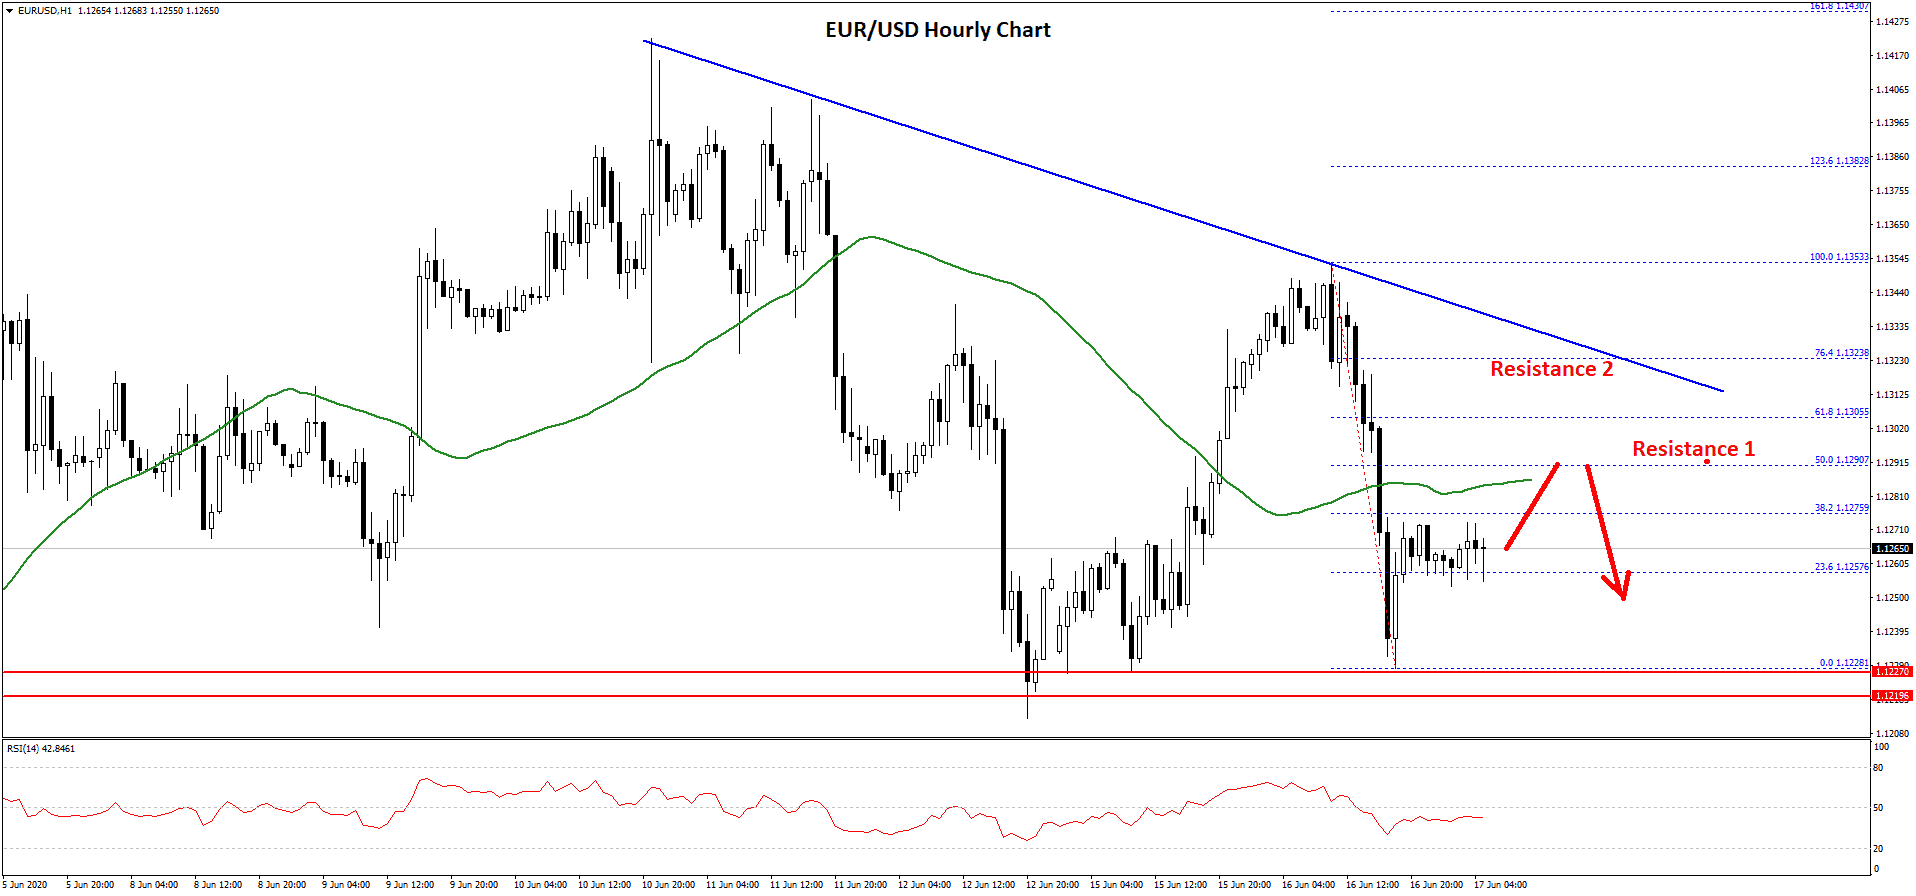
The recent low was formed near 1.1228 on FXOpen and the pair is currently correcting higher. It broke the 23.6% Fib retracement level of the recent decline from the 1.1353 high to 1.1228 low.
On the upside, an initial resistance is seen near the 1.1290 level and the 50 hourly simple moving average. The 50% Fib retracement level of the recent decline from the 1.1353 high to 1.1228 low is also near the 1.1290 level.
There is also a key bearish trend line forming with resistance near 1.1320 on the hourly chart of EUR/USD. Therefore, the pair must surpass the 1.1290 and 1.1320 resistance levels to move into a positive zone.
Conversely, EUR/USD could remain in a bearish zone and continue lower below 1.1250. The first key support is near the 1.1220 level, below which there are high chances of more losses towards the 1.1150 level.
USD/JPY Technical Analysis
The US Dollar started a major decline from well above the 109.50 zone against the Japanese Yen. The USD/JPY pair broke many supports near 108.50 to move into a bearish zone.
There was also a close below the 108.00 level and the 50 hourly simple moving average. A low was formed near 106.58 before the pair started an upside correction. It traded above the 107.00 level, but struggled to gain strength for more upsides.
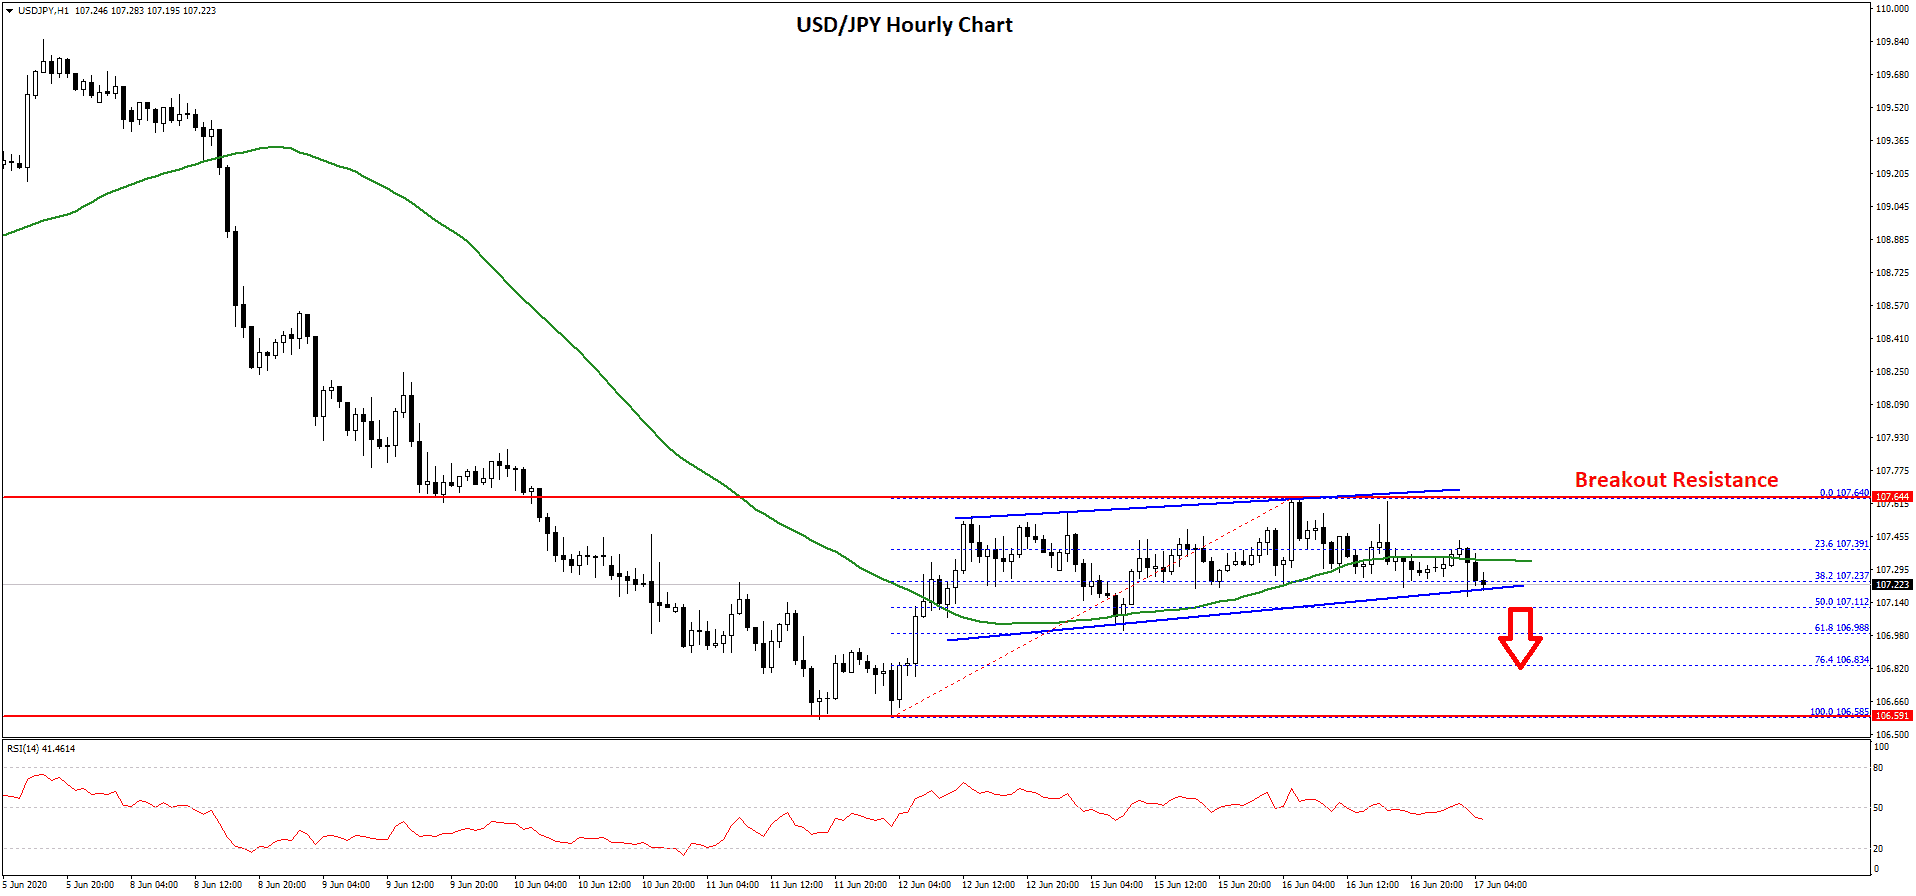
It is currently consolidating and trading near the 38.2% Fib retracement level of the recent upward move from the 106.58 low to 107.64 high. It seems like there is a short term ascending channel forming with support near 107.20 on the hourly chart.
Below the channel support, the 50% Fib retracement level of the recent upward move from the 106.58 low to 107.64 high is at 107.11. If USD/JPY breaks the channel support and 107.10, it could resume its decline.
The next major support is near the 106.50 level, below which the pair could accelerate its decline towards the 106.00 and 105.80 support levels in the near term.
On the upside, there are many hurdles forming near the 107.65 and 107.80 levels. The main resistance is still near the 108.00 level, above which USD/JPY is likely to start a strong recovery towards the 108.80 and 109.20 levels.
Trade over 50 forex markets 24 hours a day with FXOpen. Take advantage of low commissions, deep liquidity, and spreads from 0.0 pips. Open your FXOpen account now or learn more about trading forex with FXOpen.
This article represents the opinion of the Companies operating under the FXOpen brand only. It is not to be construed as an offer, solicitation, or recommendation with respect to products and services provided by the Companies operating under the FXOpen brand, nor is it to be considered financial advice.
Latest from Forex Analysis
Latest articles

Look East! An Exciting Insight into FXOpen's New Hong Kong-listed Stock CFDs
Hong Kong has built up a gilt-edged reputation as one of the world's most reputable financial market centres. The city of Hong Kong enjoyed a unique position for many years. It is situated in the Asia Pacific region, very close

AUD/USD Rises Sharply on Inflation News
The Consumer Price Index for Australia was released this morning. According to ForexFactory:
→ CPI in quarterly terms: actual = 1.0%, expected = 0.8%, previous value = 0.6%;
→ CPI in annual terms: actual = 3.5%, expected = 3.4%, previous value = 3.

TSLA Share Price Up About 13% Despite Disappointing Report
Yesterday, TSLA trading closed at USD 144.68 per share, after which Tesla reported its results for the 1st quarter:
→ earnings per share: actual = USD 0.45, forecast = USD 0.49;
→ gross income: actual = USD 21.45 billion, forecast = USD