


FXOpen
EUR/USD found support near the 1.1530 level and recovered nicely. USD/JPY is currently under bearish pressure and it seems like it could break the 111.00 support in the near term.
Important Takeaways for EUR/USD and USD/JPY
- The Euro found a strong support near the 1.1530 level and bounce back.
- EUR/USD cleared a major bearish trend line with resistance at 1.1565 on the hourly chart.
- USD/JPY is under pressure and is following a declining channel with resistance at 111.40 on the hourly chart.
- It could decline further and remains at a risk of a break below 111.00.
EUR/USD Technical Analysis
There were heavy losses noted in the Euro below the 1.1600 handle against the US Dollar. The EUR/USD pair even broke the 1.1550 support and traded as low as 1.1530.
Later, buyers took a stand near the 1.1530, resulting in a decent upward move and recovery. The pair started a correction and moved above the 1.1550 resistance. It also cleared the 23.6% Fib retracement level of the last decline from the 1.1744 high to 1.1530 low.
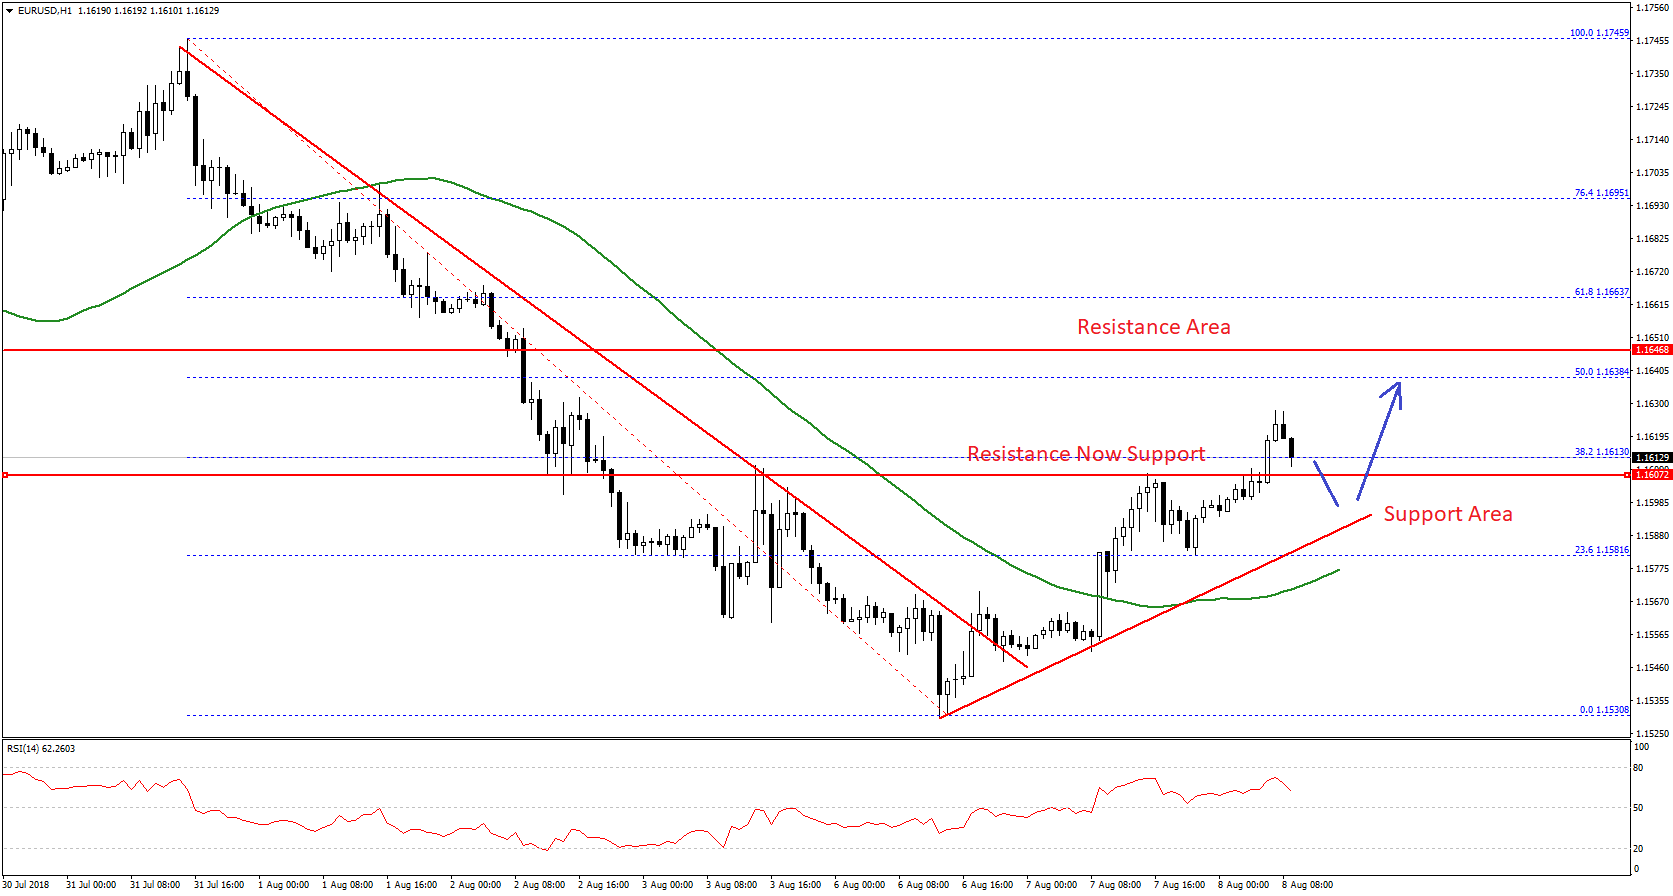
More importantly, there was a break above a major bearish trend line with resistance at 1.1565 on the hourly chart. The pair settled above the 1.1600 level and the 50 hourly simple moving average.
However, the last support area near 1.1630-40 is currently acting as a resistance. Therefore, there is a chance of a minor downside correction in EUR/USD towards the 1.1580 level. There is a bullish trend line in place with support at 1.1585, which could act as a support zone.
Below 1.1580, the pair may move back towards the 1.1550 level. On the upside, above 1.1640, the next resistance is near the 61.8% Fib retracement level of the last decline from the 1.1744 high to 1.1530 low at 1.1663.
Overall, the current price action is positive in EUR/USD as long as the pair is trading above the 1.1580 support area.
USD/JPY Technical Analysis
The US Dollar formed a major top near the 112.10 level against the Japanese Yen. The USD/JPY pair started a solid downside move and broke many supports such as 111.80 and 111.50.
The pair recently traded as low as 110.99 and bounced back above 111.20. However, the upside move was capped by the 111.50 resistance. More importantly, there is a significant declining channel in place with resistance at 111.40 on the hourly chart.
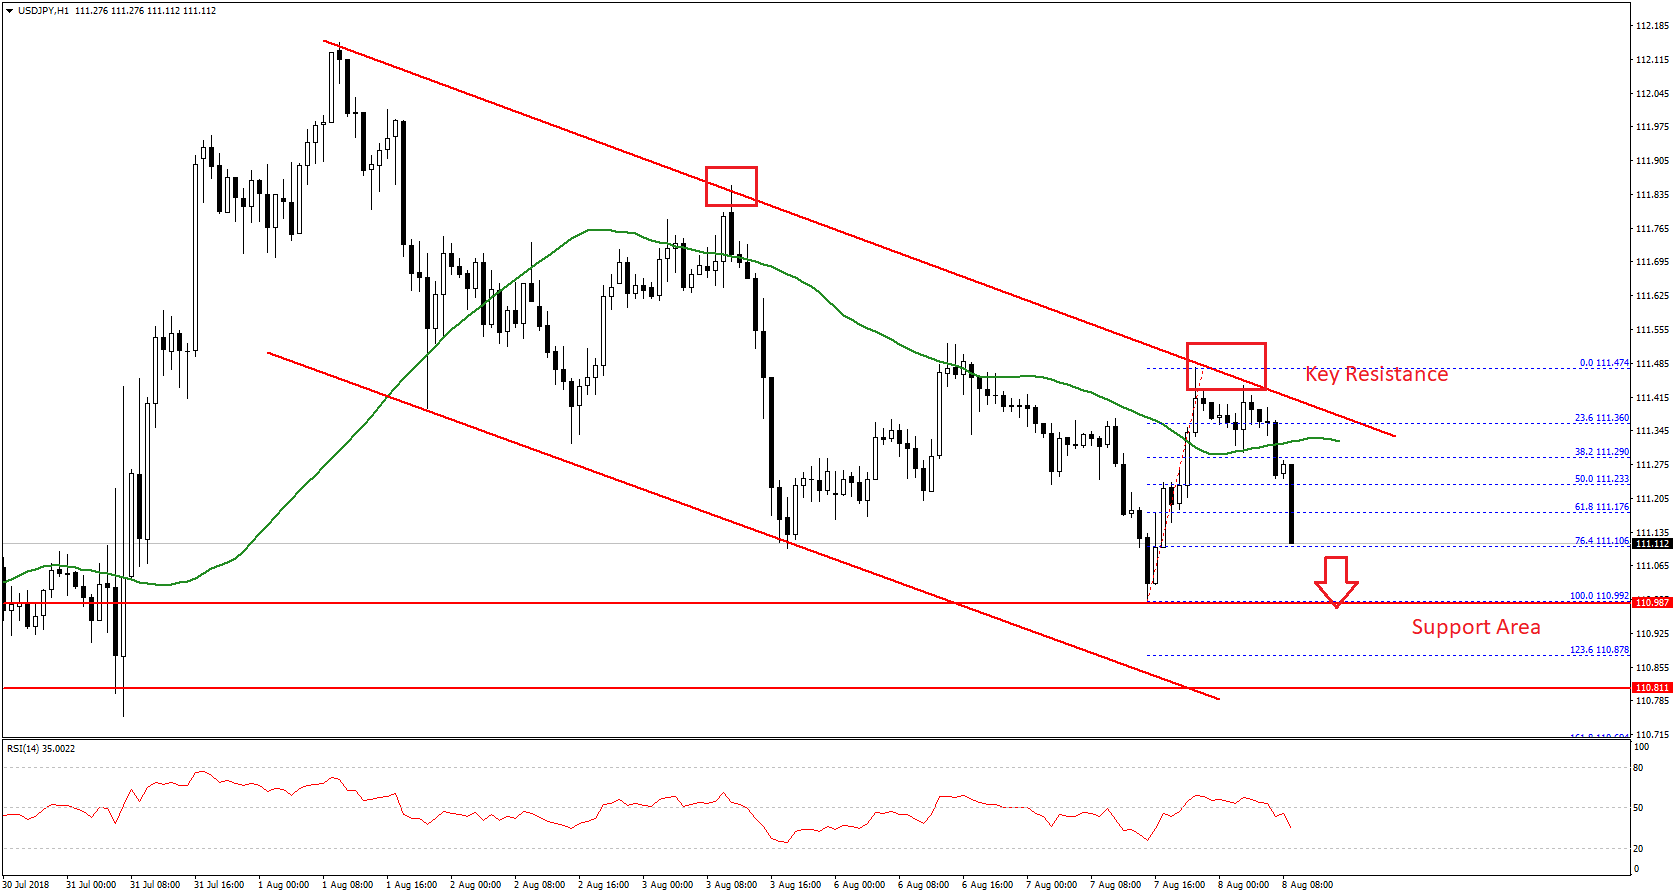
The pair declined once again and broke the 111.20 support plus the 50 hourly simple moving average. Additionally, there was a break below the 50% Fib retracement level of the last wave from the 110.99 low to 111.47 high.
Therefore, there are high chances of more losses in USD/JPY below 111.10 in the near term. The pair may perhaps break the 111.00 support if sellers remain in action. The next support below 111.00 is near the 1.236 Fib extension level of the last wave from the 110.99 low to 111.47 high at 110.87.
Below 110.87, the pair could trade towards the 110.60 level. On the flip side, if the pair corrects higher form the current levels, it may well face sellers near the 111.20 level. Above this, the channel resistance at 111.40 is likely to act as a solid barrier for buyers.
Trade over 50 forex markets 24 hours a day with FXOpen. Take advantage of low commissions, deep liquidity, and spreads from 0.0 pips. Open your FXOpen account now or learn more about trading forex with FXOpen.
This article represents the opinion of the Companies operating under the FXOpen brand only. It is not to be construed as an offer, solicitation, or recommendation with respect to products and services provided by the Companies operating under the FXOpen brand, nor is it to be considered financial advice.
Latest from Forex Analysis
Latest articles

Anchored VWAP and How You Can Use It in Forex Trading
In the world of forex trading, understanding the nuanced tools at your disposal can significantly enhance decision-making processes. One such sophisticated tool is the Anchored Volume-Weighted Average Price (Anchored VWAP), which refines the standard VWAP by allowing traders to set

META Share Price Collapses after Publication of Quarterly Report
Just yesterday, META's stock price closed at USD 493.50, up approximately 40% since the start of 2024 and up nearly 300% since the start of 2023.
However, following the release of Meta's quarterly report, its shares plummeted to USD

USD/JPY Analysis: The Rate Exceeds The Level of 155 Yen Per US Dollar
Today, the price of USD/JPY once again renewed its 34-year high, exceeding the level of 155 yen per dollar, which put pressure on the current authorities.
According to Reuters, officials are trying to maintain calm in the market.
"We