


FXOpen

EUR/USD started an upside correction after trading towards the 1.0880 level. USD/CHF is currently under pressure and it could continue to slide towards the 0.9900 support area.
Important Takeaways for EUR/USD and USD/CHF
- The Euro found support near the 1.0880 level after a steady decline against the US Dollar.
- There was a break above a major bearish trend line with resistance near 1.0915 on the hourly chart of EUR/USD.
- USD/CHF struggled to stay above the 1.0000 level and recently declined below 0.9980.
- There was a break below a key bullish trend line with support near 0.9940 on the hourly chart.
EUR/USD Technical Analysis
In the past few days, there was a steady decline in the Euro from well above the 1.1000 level against the US Dollar. The EUR/USD pair broke many supports near the 1.0950 level to enter a bearish zone.
Moreover, there was a close below the 1.0920 level the 50 hourly simple moving average. The pair traded towards the 1.0880 support and a low was formed near 1.0879 on FXOpen.
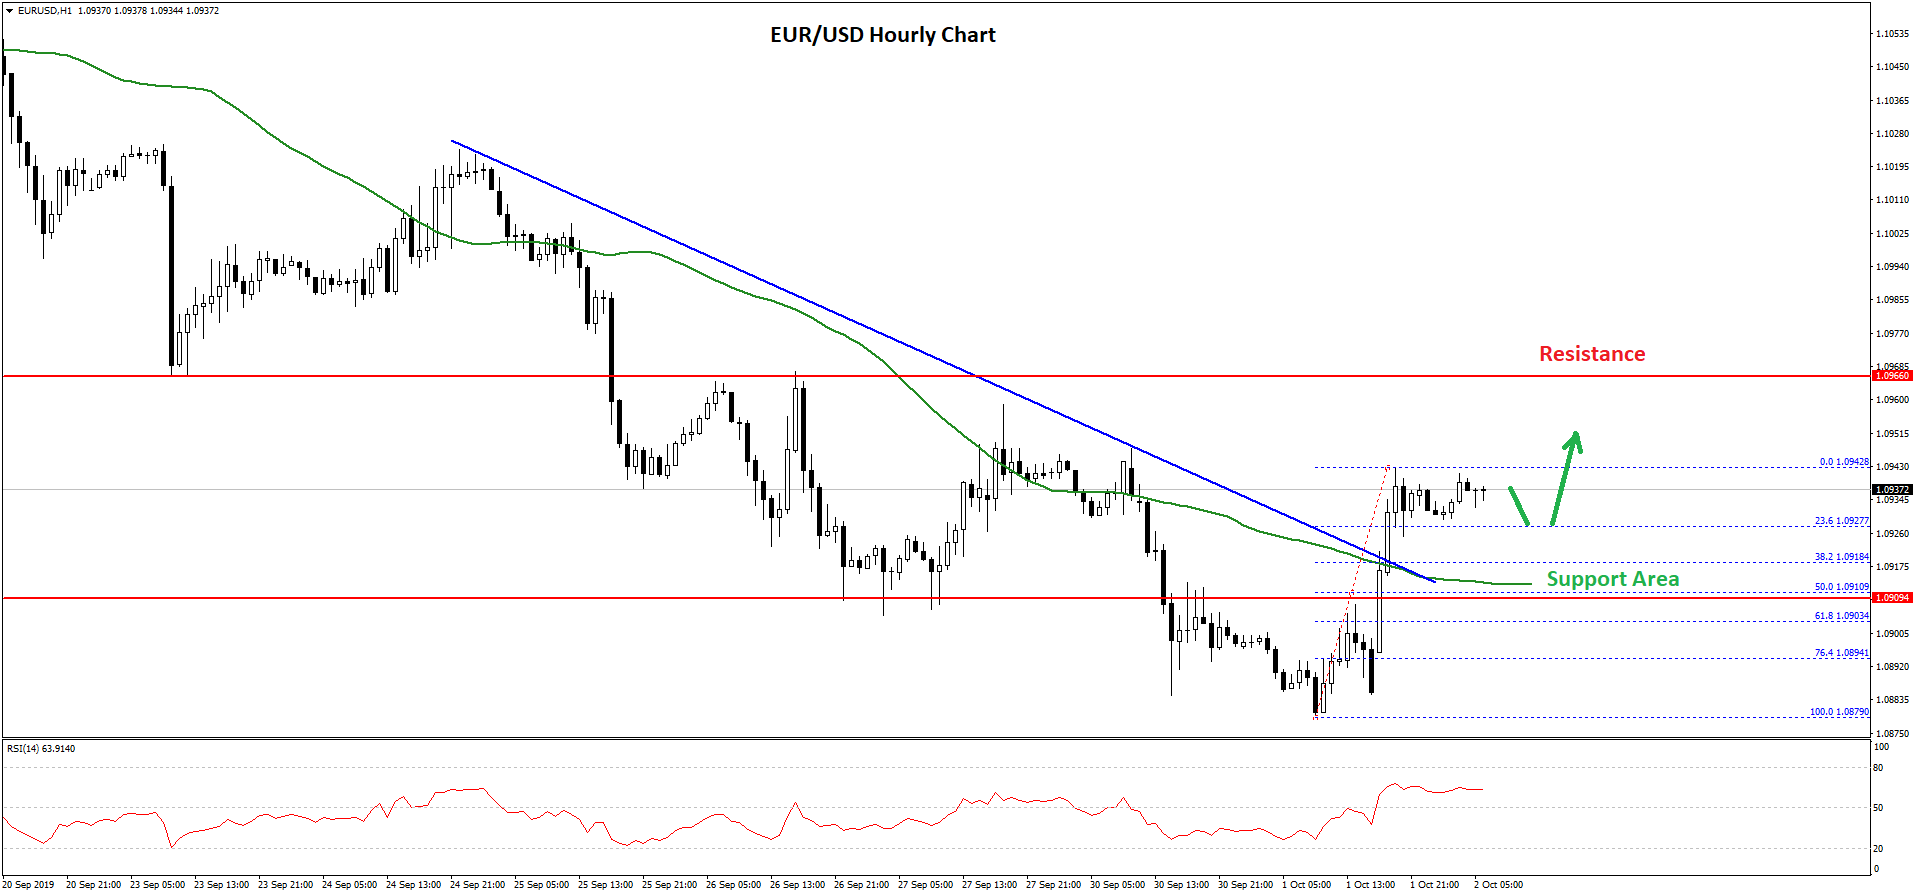
Recently, the pair started an upside correction and traded above the 1.0900 level. Furthermore, there was a close above the 1.0900 level and the 50 hourly simple moving average. More importantly, there was a break above a major bearish trend line with resistance near 1.0915 on the hourly chart of EUR/USD.
The pair traded as high as 1.0942 and it is currently consolidating gains. An immediate support is near the 23.6% Fib retracement level of the recent wave from the 1.0879 low to 1.0942 high.
However, the main support is near the 1.0910 level and the 50 hourly SMA. Moreover, the 50% Fib retracement level of the recent wave from the 1.0879 low to 1.0942 high is also near the 1.0910 level.
If there is a break below 1.0910 and 1.0900, the pair could resume its decline towards the 1.0850 level. On the upside, an immediate resistance is near the 1.0940 level. A clear break above the 1.0940 and 1.0950 levels is must for more gains towards the 1.1000 level.
USD/CHF Technical Analysis
The US Dollar followed a solid bullish path and even broke the 1.0000 resistance against the Swiss franc. However, the USD/CHF pair failed to stay above the 1.0000 level and topped near the 1.0016 level.
Recently, there was a sharp decline below the 1.0000 support area and the 50 hourly simple moving average. During the decline, there was a break below the 50% Fib retracement level of the last wave from the 0.9898 low to 1.0016 high.
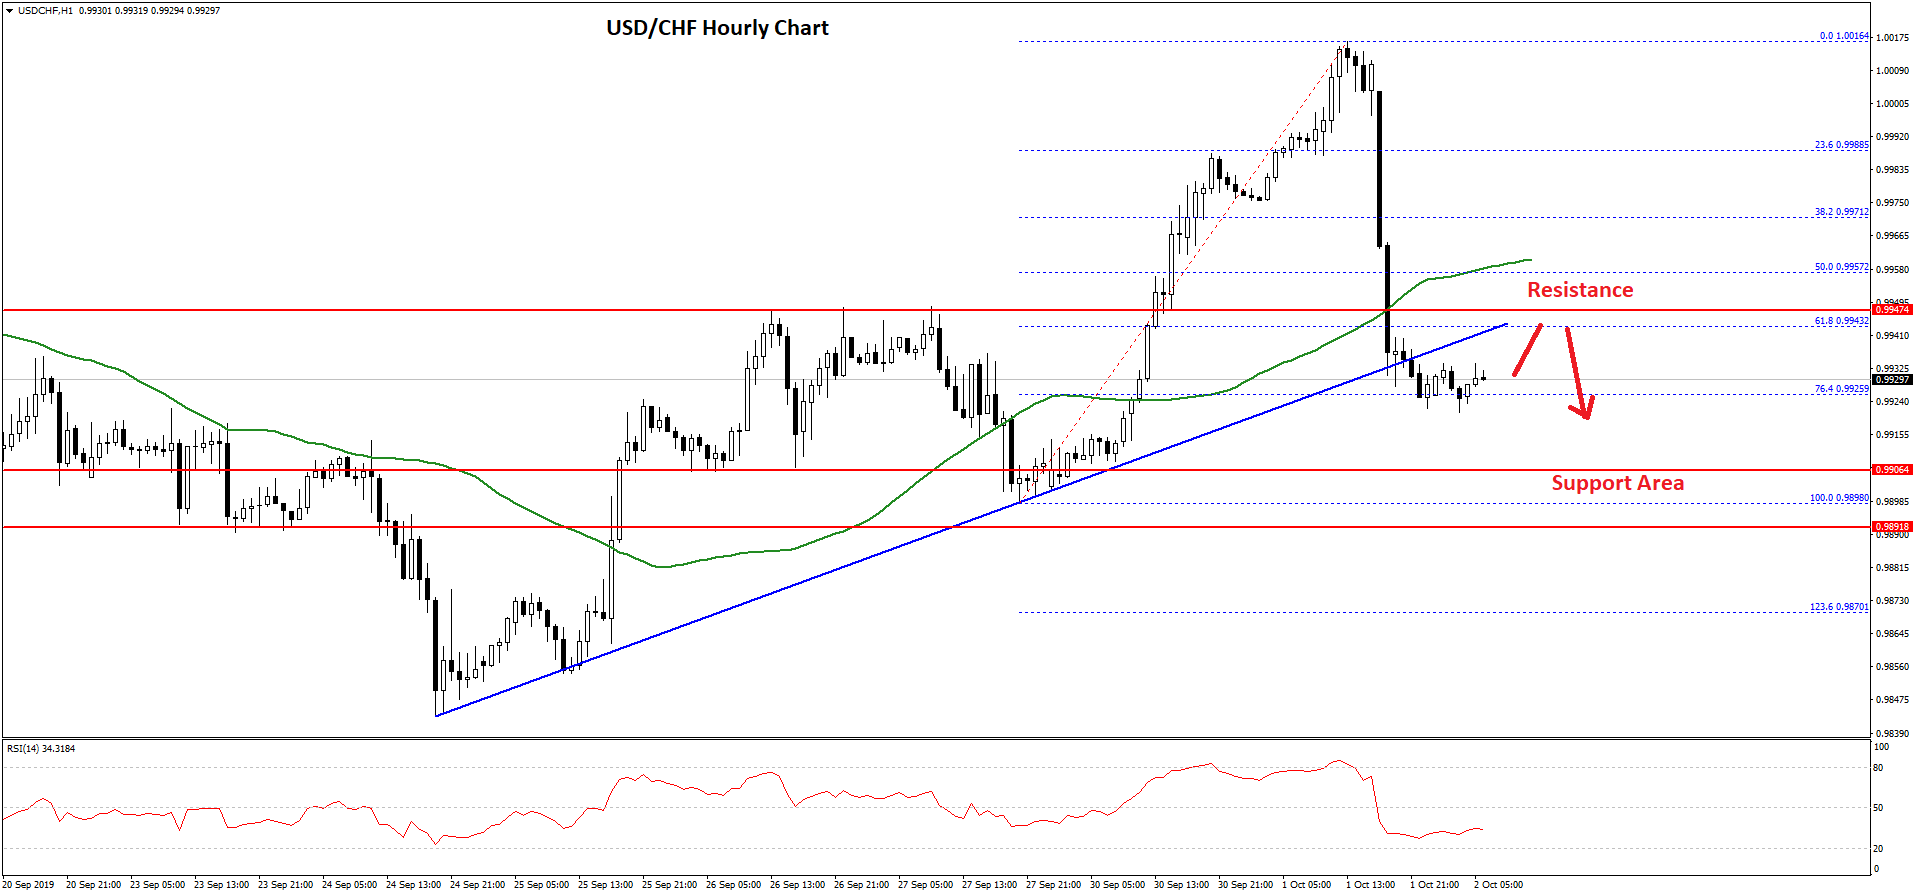
Moreover, there was a break below a key bullish trend line with support near 0.9940 on the hourly chart. The pair tested the 0.9925 level, plus the 76.4% Fib retracement level of the last wave from the 0.9898 low to 1.0016 high.
On the downside, there are many supports near the 0.9900 level. If the pair fails to stay above the 0.9900 support area, there are chances of further losses towards the 0.9860 level.
On the upside, the previous support near the 0.9940 and 0.9950 levels might act as a hurdle for an upward move. A clear break above the 0.9950 level and the 50 hourly SMA could open the doors for a push towards the 1.0000 barrier.
Trade over 50 forex markets 24 hours a day with FXOpen. Take advantage of low commissions, deep liquidity, and spreads from 0.0 pips. Open your FXOpen account now or learn more about trading forex with FXOpen.
This article represents the opinion of the Companies operating under the FXOpen brand only. It is not to be construed as an offer, solicitation, or recommendation with respect to products and services provided by the Companies operating under the FXOpen brand, nor is it to be considered financial advice.
Latest from Forex Analysis
Latest articles

Weekly Market Wrap With Gary Thomson: UK100, USD, GOLD, OIL
Get the latest scoop on the week's hottest headlines, all in one convenient video. Join Gary Thomson, the COO of FXOpen UK, as he breaks down the most significant news reports and shares his expert insights.
- UK100 Share Index Rises

What Is a Darvas Box Theory and How Does It Work in Trading?
The Darvas Box Theory, pioneered by Nicolas Darvas in the 1950s, has transcended its stock market origins to become a valuable tool for forex traders. This method leverages specific price movements and patterns, known as the Darvas Box, to track

NFLX Stock Price Falls Despite Subscriber Growth
Yesterday, after the close of the main trading session on the stock market, Netflix reported to investors for the 1st quarter of 2024.
The report turned out better than expected:
→ earnings per share: actual = USD 5.28, forecast = USD 4.