


FXOpen

EUR/USD declined heavily and recently started an upside correction from the 1.1110 support area. USD/JPY is trading in a solid uptrend and it could continue to rise above 108.80 and 109.00.
Important Takeaways for EUR/USD and USD/JPY
- The Euro declined heavily after it broke the 1.1265 and 1.1210 support levels.
- Recently, there was a break above a key bearish trend line with resistance near 1.1140 on the hourly chart of EUR/USD.
- USD/JPY is following a nice uptrend above the key 108.20 and 108.40 support levels.
- There is a major bullish trend line forming with support near 108.50 on the hourly chart.
EUR/USD Technical Analysis
The Euro declined heavily in the past few days below the 1.1265 and 1.1210 support levels against the US Dollar. The EUR/USD pair even broke the 1.1180 support level to enter a bearish zone.
Moreover, there was a close below the 1.1180 level and the 50 hourly simple moving average. Finally, the pair traded below the 1.1120 level and a new monthly low was formed near 1.1101 on FXOpen.
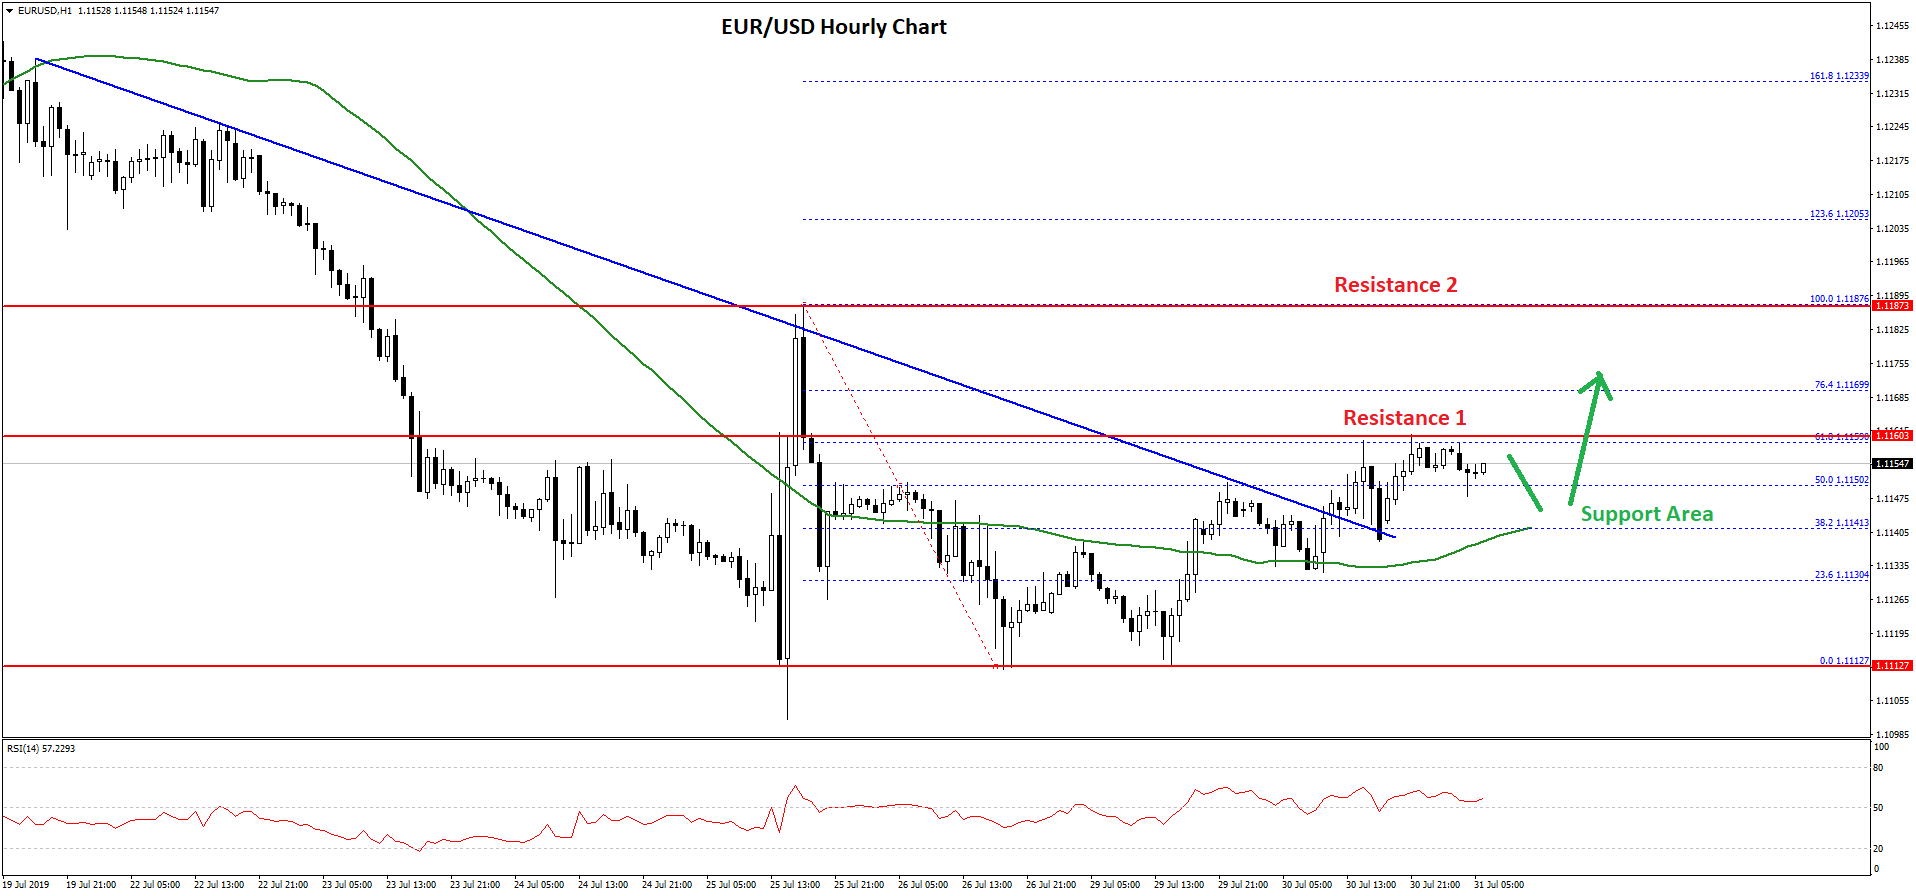
Recently, the pair started an upside correction after forming a support base near the 1.1110 level. There was a break above the 1.1140 resistance and the 50 hourly simple moving average.
The pair surpassed the 50% Fib retracement level of the recent decline from the 1.1187 high to 1.1101 low. Moreover, there was a break above a key bearish trend line with resistance near 1.1140 on the hourly chart of EUR/USD.
The pair tested the 1.1160 resistance plus the 61.8% Fib retracement level of the recent decline from the 1.1187 high to 1.1101 low. It is currently consolidating in a range and it seems like there could be more gains above the 1.1160 and 1.1180 resistance levels.
On the downside, the 1.1140 level and the 50 hourly SMA might provide support. If there is a close below the 1.1140 support, the pair is likely to resume its downtrend.
USD/JPY Technical Analysis
The US Dollar remained in a strong uptrend and it broke many hurdles near 108.00 and 108.20 against the Japanese Yen. The USD/JPY pair even surpassed the 108.50 resistance level to post a new weekly high.
Finally, there was a break above the 108.80 level and the pair traded close to the 109.00 level. A swing high was formed near 108.94 and the pair recently corrected lower.
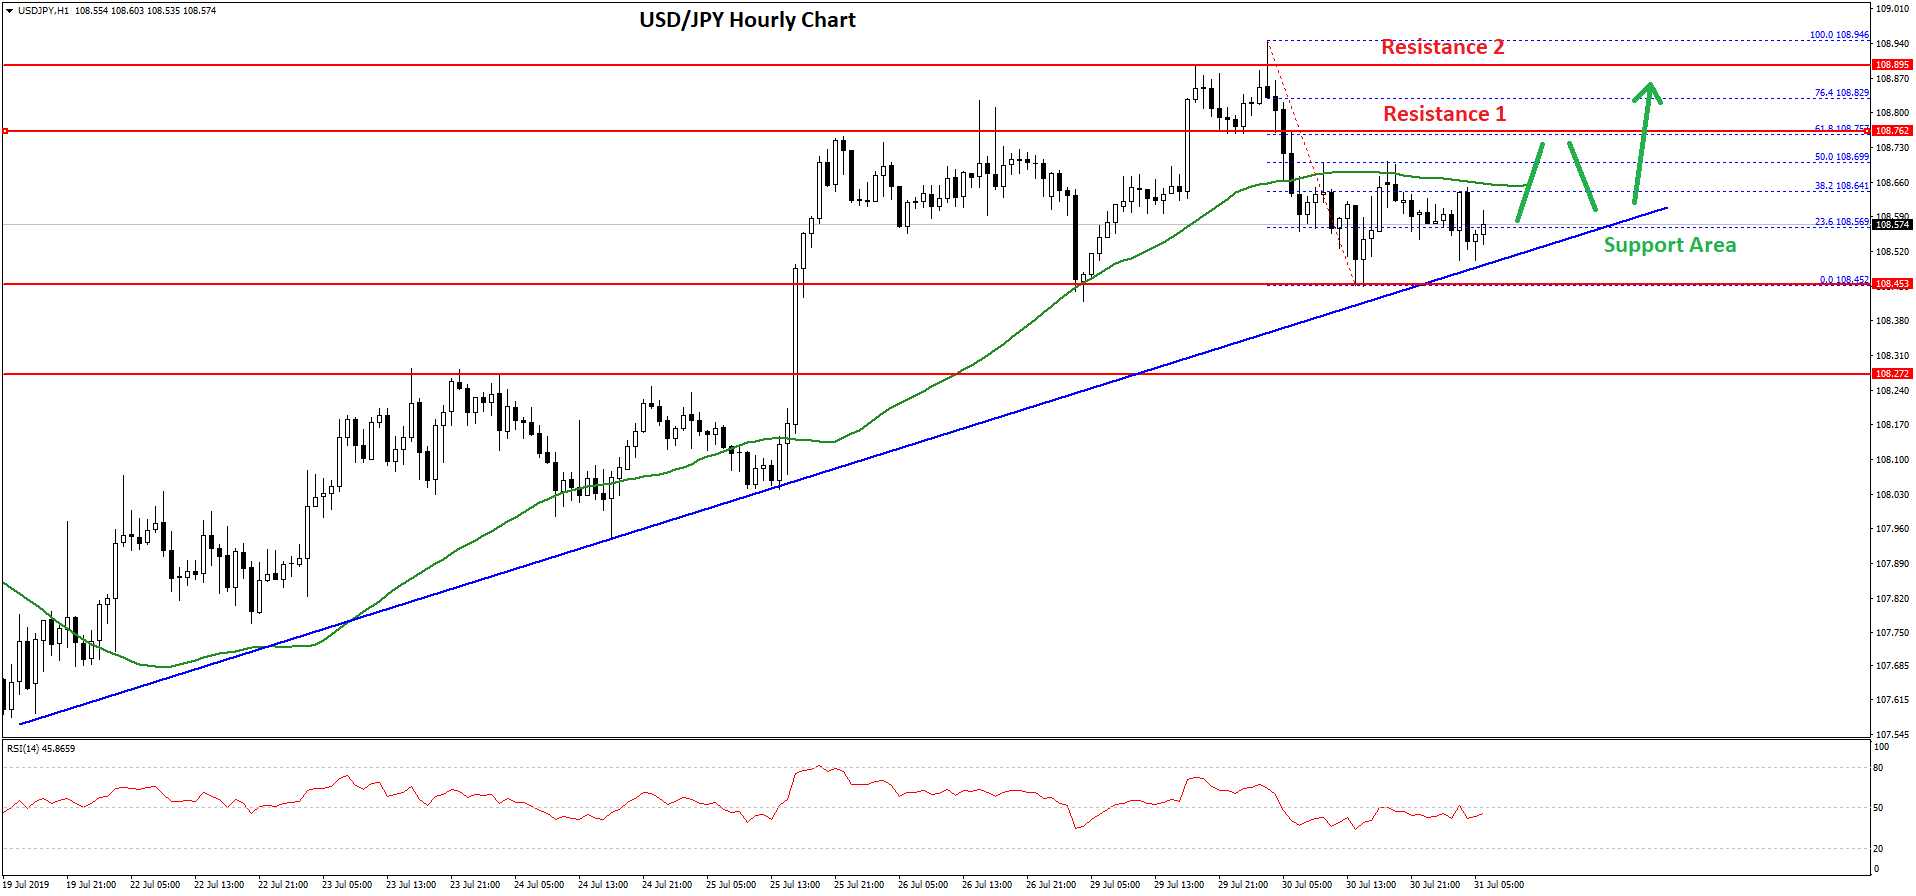
There was a break below the 108.70 level and the 50 hourly simple moving average. A swing low was formed near 108.45 and recently the pair started a fresh increase. However, the upward move was capped by the 108.70 level and the 50 hourly simple moving average.
Moreover, the 50% Fib retracement level of the last drop from the 108.94 high to 108.45 low acted as a resistance. On the downside, there are many supports near the 108.50 and 108.40 levels.
There is also a major bullish trend line forming with support near 108.50 on the hourly chart. Therefore, dips remain well supported on the downside near the 108.50 and 108.40 levels.
The main support on the downside is near the 108.20 level. On the upside, the pair needs to surpass the 108.70 and 108.80 levels to revisit the 109.00 resistance area in the coming sessions. Above 109.00, the pair could test the 109.40 level.
Trade over 50 forex markets 24 hours a day with FXOpen. Take advantage of low commissions, deep liquidity, and spreads from 0.0 pips. Open your FXOpen account now or learn more about trading forex with FXOpen.
This article represents the opinion of the Companies operating under the FXOpen brand only. It is not to be construed as an offer, solicitation, or recommendation with respect to products and services provided by the Companies operating under the FXOpen brand, nor is it to be considered financial advice.
Latest from Forex Analysis
Latest articles

Weekly Market Wrap With Gary Thomson: UK100, USD, GOLD, OIL
Get the latest scoop on the week's hottest headlines, all in one convenient video. Join Gary Thomson, the COO of FXOpen UK, as he breaks down the most significant news reports and shares his expert insights.
- UK100 Share Index Rises

What Is a Darvas Box Theory and How Does It Work in Trading?
The Darvas Box Theory, pioneered by Nicolas Darvas in the 1950s, has transcended its stock market origins to become a valuable tool for forex traders. This method leverages specific price movements and patterns, known as the Darvas Box, to track

NFLX Stock Price Falls Despite Subscriber Growth
Yesterday, after the close of the main trading session on the stock market, Netflix reported to investors for the 1st quarter of 2024.
The report turned out better than expected:
→ earnings per share: actual = USD 5.28, forecast = USD 4.