


FXOpen

EUR/USD failed to clear the 1.1800 resistance zone and started a downside correction. USD/CHF is correcting higher and showing positive signs above 0.9165.
Important Takeaways for EUR/USD and USD/CHF
- The Euro failed once again to clear the key 1.1800 resistance zone against the US Dollar.
- There was a break below a major bullish trend line with support near 1.1740 on the hourly chart of EUR/USD.
- USD/CHF traded as low as 0.9133 and recently started an upside correction.
- There was a break above a key bearish trend line with resistance near 0.9175 on the hourly chart.
EUR/USD Technical Analysis
This week, the Euro made a few attempts to clear the 1.1800 resistance zone against the US Dollar. The EUR/USD pair failed to extend gains and started a fresh decline.
A high was formed near 1.1807 on FXOpen before the pair broke the 1.1780 support level. There was a clear break below the 1.1765 support level and the 50 hourly simple moving average to start the current decline.
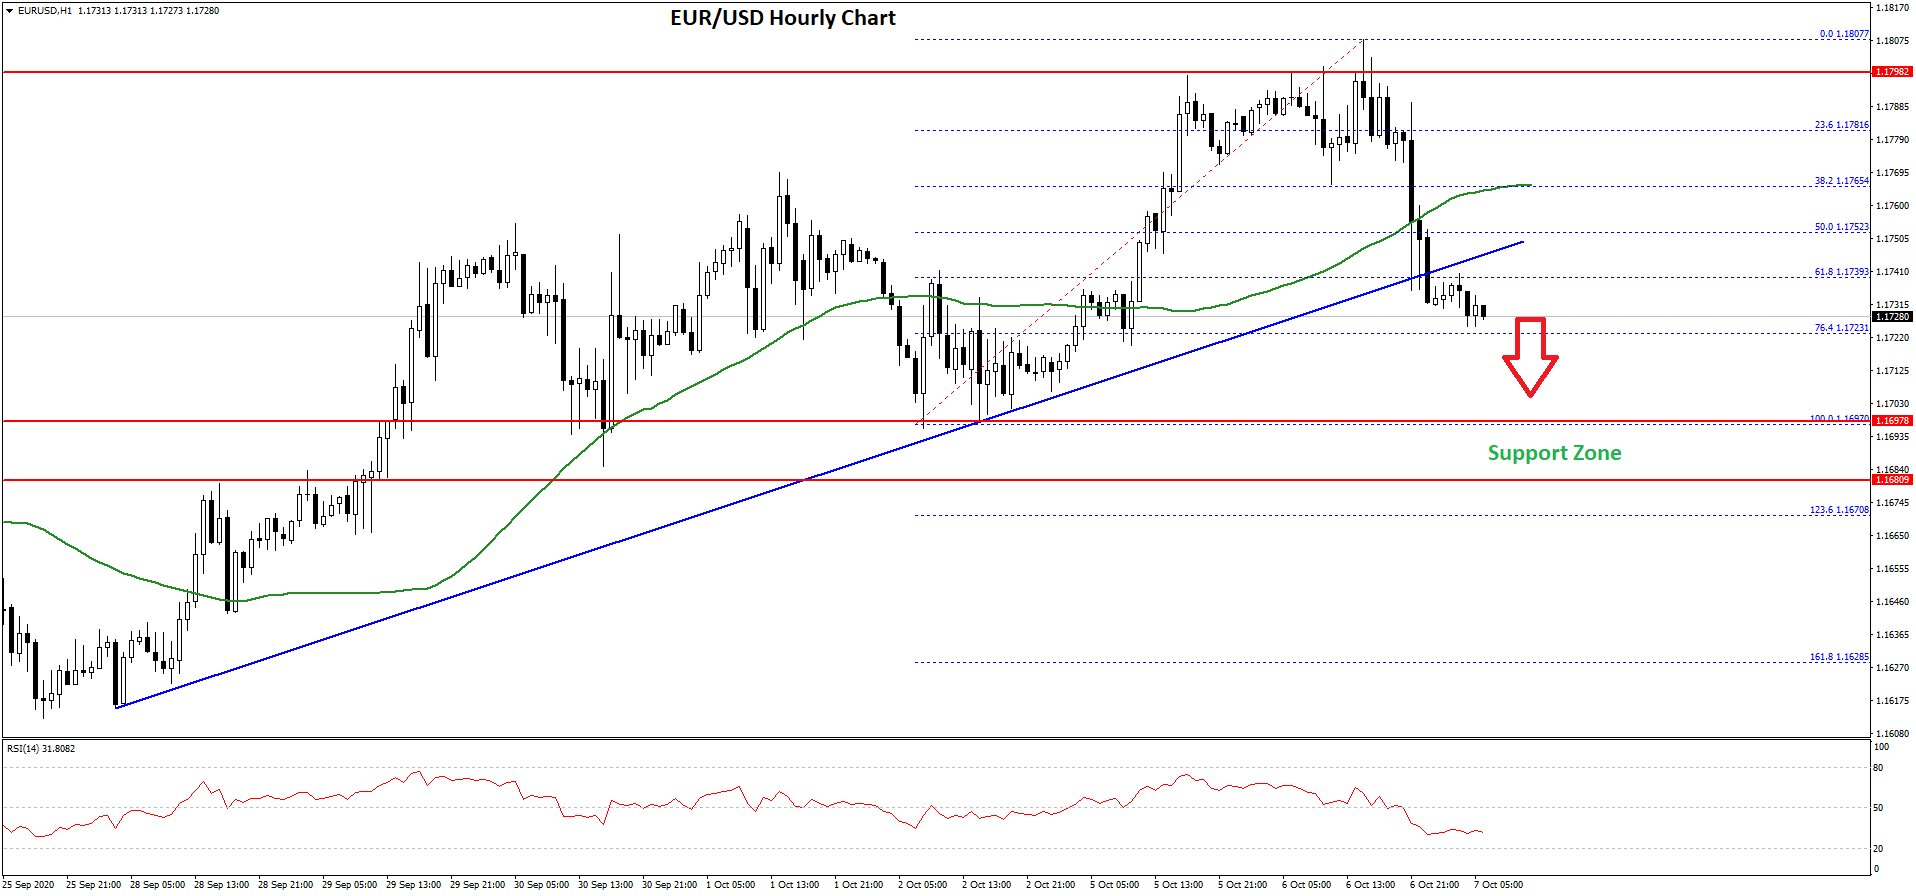
The pair even broke the 50% Fib retracement level of the upward move from the 1.1697 swing low to 1.1807 high. More importantly, there was a break below a major bullish trend line with support near 1.1740 on the hourly chart of EUR/USD.
The pair is now trading below the 1.1750 support level. An initial support is near the 1.1720 level or the 76.4% Fib retracement level of the upward move from the 1.1697 swing low to 1.1807 high.
The next major support is near the 1.1700 zone, below which the pair might accelerate lower towards the 1.1650 and 1.1620 levels. Conversely, the pair might start a fresh increase above the 1.1750 resistance.
The first major resistance is near the 1.1765 level and the 50 hourly simple moving average. A clear break above the 1.1765 level might lead the pair back towards the main 1.1800 resistance level in the coming sessions.
USD/CHF Technical Analysis
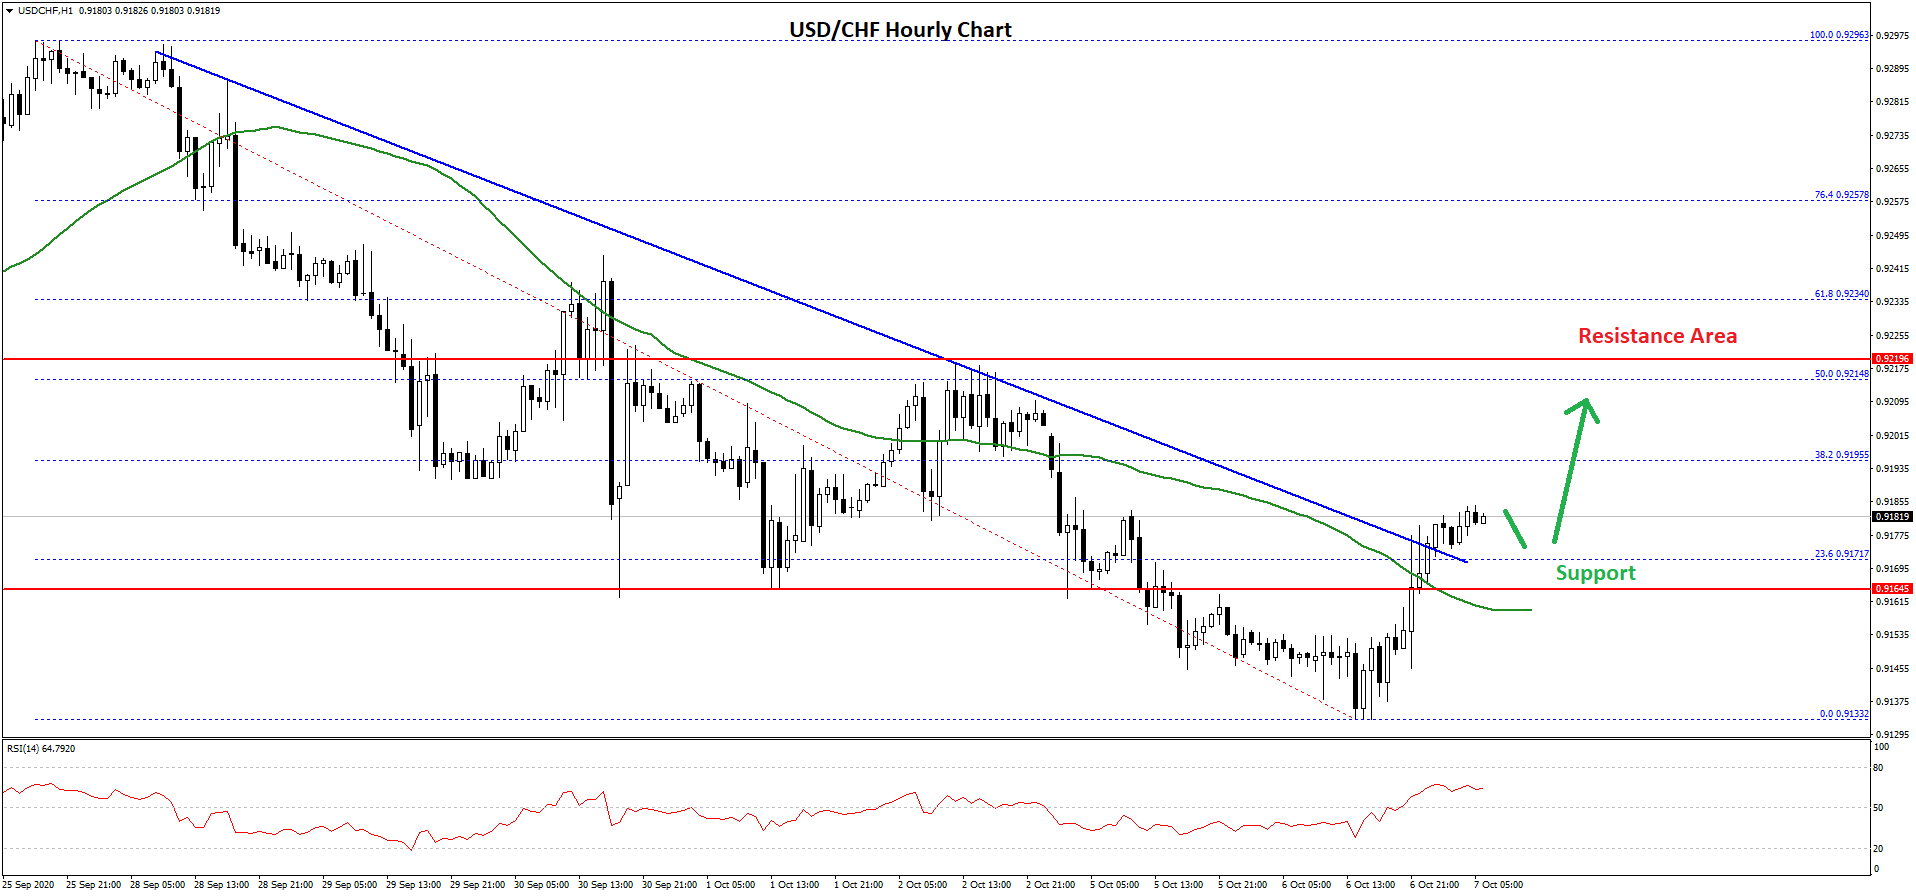
After a steady decline, the US Dollar found support near the 0.9130 area against the Swiss franc. The USD/CHF pair traded as low as 0.9133 and recently started a fresh upward move.
There was a break above the 0.9150 resistance level. The pair even broke the 23.6% Fib retracement level of the downward move from the 0.9296 high to 0.9133 low. Moreover, there was a break above a key bearish trend line with resistance near 0.9175 on the hourly chart.
 ur
ur
The pair is now trading nicely above the 0.9180 level and the 50 hourly simple moving average. The next resistance could be near the 0.9200 level.
The first major resistance is near the 0.9215 level since it is close to the 50% Fib retracement level of the downward move from the 0.9296 high to 0.9133 low. A clear break above the 0.9200 resistance and follow up move above 0.9215 might open the doors for more gains in the near term.
The next key resistance is near the 0.9255 level. If there is a downside correction, the pair might find support near the 0.9165 level or the 50 hourly simple moving average.
The next major support is near the 0.9150 level, below which there is a risk of a bearish wave towards the 0.9100 support level.
Trade over 50 forex markets 24 hours a day with FXOpen. Take advantage of low commissions, deep liquidity, and spreads from 0.0 pips. Open your FXOpen account now or learn more about trading forex with FXOpen.
This article represents the opinion of the Companies operating under the FXOpen brand only. It is not to be construed as an offer, solicitation, or recommendation with respect to products and services provided by the Companies operating under the FXOpen brand, nor is it to be considered financial advice.
Latest from Forex Analysis
Latest articles

How to Identify and Trade Liquidity Grabs
Understanding the intricacies of market liquidity and the role of liquidity grabs can be crucial for optimising trading strategies. Liquidity grabs, creating rapid price movements, are a key component of Smart Money trading. This article explores how to identify these

What Is a Piercing Line Pattern, and How Can You Trade with It?
In the world of technical analysis, the piercing line pattern stands out as a solid indicator of potential market reversals. This article delves into the nuances of this two-candlestick pattern, exploring its formation, significance, and how traders can effectively leverage

London Calling! FTSE 100 Stocks Flying High Once Again
Back in 2021, which when looking at a physical calendar does not seem such a long time ago yet feels like an epoch ago when considering the changes in global economies and the capital markets since then, the FTSE 100