


FXOpen

EUR/USD declined recently below the 1.1780 support, but it found support near 1.1730. USD/JPY is showing bearish signs below the key 105.50 resistance level.
Important Takeaways for EUR/USD and USD/JPY
- The Euro started a substantial decline below the 1.1800 and 1.1780 support levels.
- There was a break below a key bullish trend line with support near 1.1765 on the hourly chart of EUR/USD.
- USD/JPY started a fresh decline after it failed to clear the main 106.00 resistance zone.
- There is a major bearish trend line forming with resistance near 105.50 on the hourly chart.
EUR/USD Technical Analysis
This past week, the Euro climbed above the 1.1800 and 1.1820 levels against the US Dollar. However, the EUR/USD pair struggled to gain momentum and formed a short-term top near the 1.1830 level.
As a result, there was a downward move below the 1.1800 support level. The pair broke the 1.1780 support level and the 50 hourly simple moving average. Moreover, there was a break below a key bullish trend line with support near 1.1765 on the hourly chart of EUR/USD.
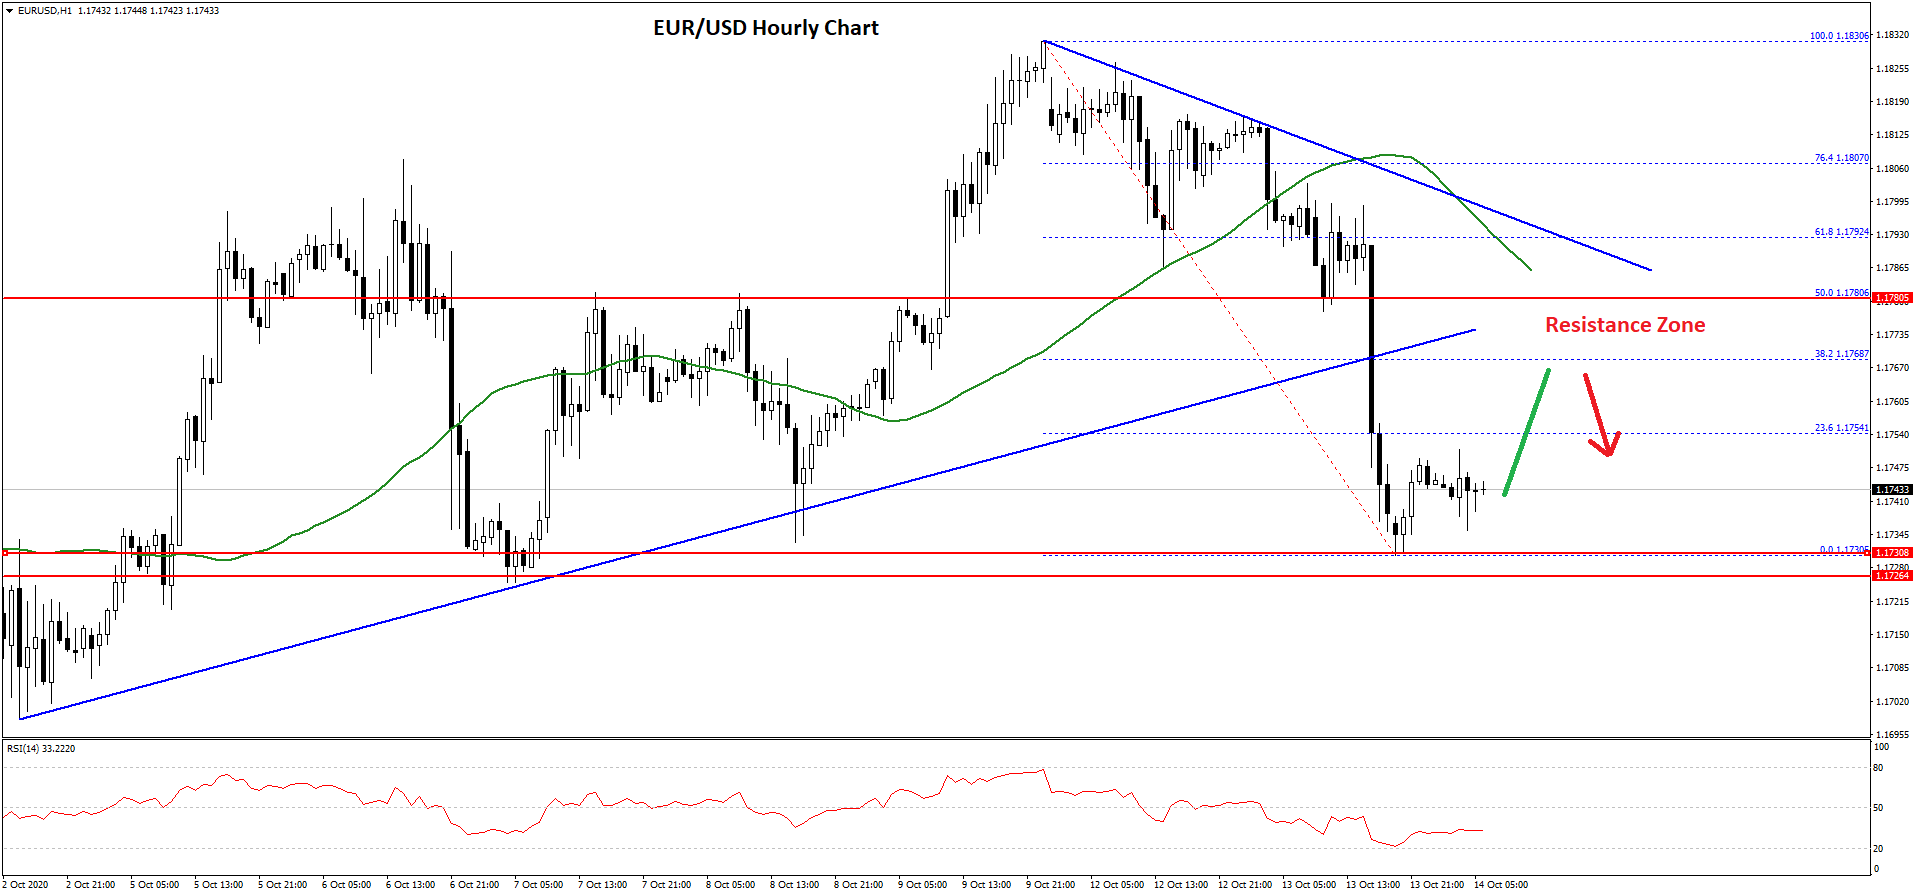
The pair even broke the 1.1750 support and traded as low as 1.1730 on FXOpen. It is currently consolidating losses above the 1.1730 low. An initial resistance on the upside is near the 1.1750 level.
The 23.6% Fib retracement level of the downward move from the 1.1830 high to 1.1730 low is also near the 1.1754 level. The next major resistance on the upside is near the 1.1780 level.
The 50% Fib retracement level of the downward move from the 1.1830 high to 1.1730 low is near 1.1780 to act as a hurdle. More importantly, the 50 hourly simple moving average is aligned near 1.1790 and a connecting bearish trend line on the same chart.
Therefore, the pair is likely to face a lot of hurdles if it corrects higher towards 1.1780 and 1.1800. Conversely, EUR/USD could continue to move down below the 1.1730 low. The next major support is near the 1.1700 level, below which the pair could test the 1.1660 level.
USD/JPY Technical Analysis
The US Dollar struggled to clear the 106.20 resistance and started a fresh decline against the Japanese Yen. The USD/JPY pair broke the 105.80 support zone to move into a bearish zone.
There was a clear break below the key 105.50 support level and the 50 hourly simple moving average. It opened the doors for more downsides and the pair traded as low as 105.24. Recently, there was an upside correction, but the pair struggled to clear the 105.60 zone.
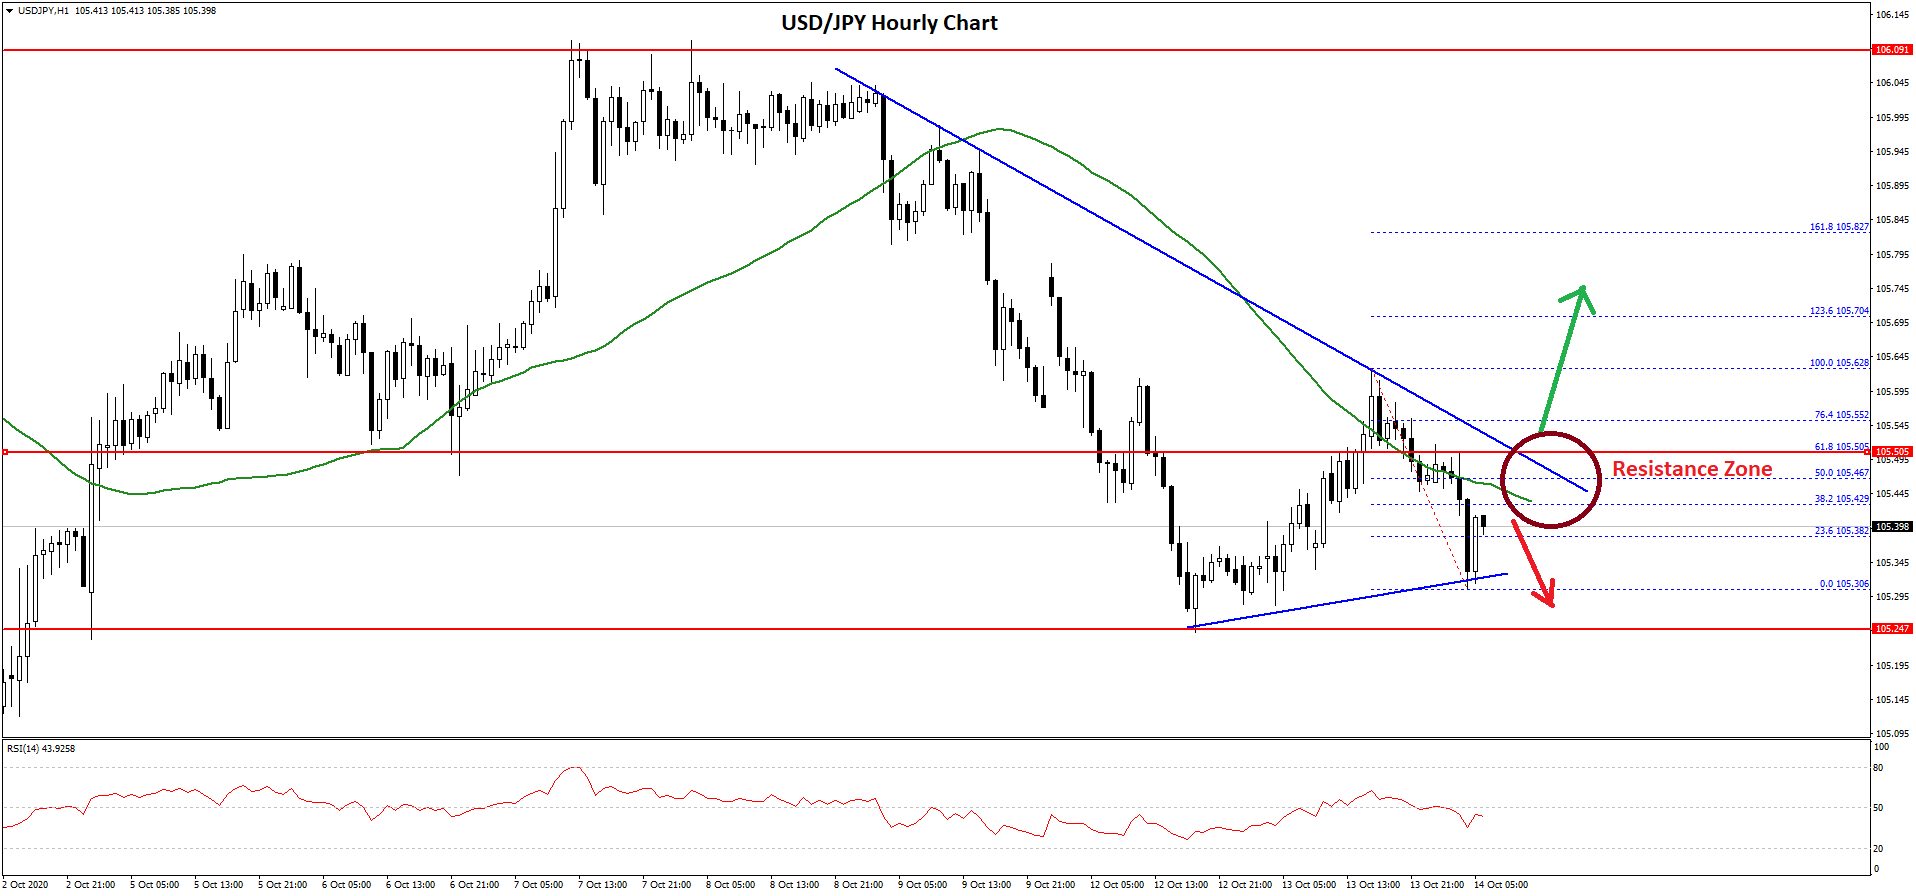
It resumed its decline and traded as low as 105.30. USD/JPY is currently correcting higher and trading above the 23.6% Fib retracement level of the recent decline from the 105.62 high to 105.30 low.
On the upside, there is a crucial resistance forming near 105.50. There is also a major bearish trend line forming with resistance near 105.50 on the hourly chart. The trend line is close to the 50% Fib retracement level of the recent decline from the 105.62 high to 105.30 low.
A successful break above the 105.50 and 105.60 resistance levels might open the doors for a fresh increase. The next major hurdle is near 106.00.
Conversely, USD/JPY might resume its decline below the 105.30 level. The next major support is near 105.00, followed by 104.80.
Trade over 50 forex markets 24 hours a day with FXOpen. Take advantage of low commissions, deep liquidity, and spreads from 0.0 pips. Open your FXOpen account now or learn more about trading forex with FXOpen.
This article represents the opinion of the Companies operating under the FXOpen brand only. It is not to be construed as an offer, solicitation, or recommendation with respect to products and services provided by the Companies operating under the FXOpen brand, nor is it to be considered financial advice.
Latest from Forex Analysis
Latest articles

AUD/USD Rises Sharply on Inflation News
The Consumer Price Index for Australia was released this morning. According to ForexFactory:
→ CPI in quarterly terms: actual = 1.0%, expected = 0.8%, previous value = 0.6%;
→ CPI in annual terms: actual = 3.5%, expected = 3.4%, previous value = 3.

TSLA Share Price Up About 13% Despite Disappointing Report
Yesterday, TSLA trading closed at USD 144.68 per share, after which Tesla reported its results for the 1st quarter:
→ earnings per share: actual = USD 0.45, forecast = USD 0.49;
→ gross income: actual = USD 21.45 billion, forecast = USD

Market Analysis: Gold Price Corrects Gains While Oil Price Regains Strength
Gold price rallied above $2,400 before correcting lower. Crude oil price is rising and it could climb further higher toward the $85.50 resistance.
Important Takeaways for Gold and Oil Prices Analysis Today
· Gold price rallied significantly above $2,